The Call Tree panel shows the hierarchy of function calls or object references for the routines, classes or objects selected in the Report panel. The contents of the Call Tree panel depend on the selected profiler.
Performance Profiler
When the Performance profiler is selected, the Call Tree panel displays the hierarchy of calls for the routine that is currently selected in the Report panel. The Call Tree panel contains two panes: Parents and Children.
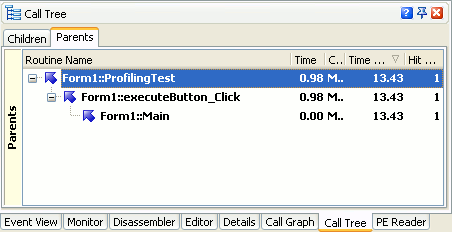
The Parents pane displays a tree of calls that led to a call to the given routine.
Similarly, the Children pane displays the tree of calls started by the given routine.
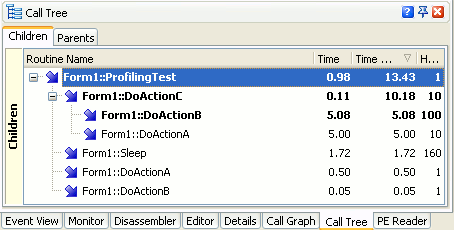
For the routine chosen in the Report panel, both panes display all the routes of routine calls that were used during profiling. So you can easily retrace the desired route.
Note that in both Parents and Children panes the routine selected in the Report panel is the start node of the panes’ trees. As a result, these panes display their call trees in different chronological order. In the Children pane, the call hierarchy is displayed in the direct order (a routine that was called by another routine is displayed as a child of that routine’s node in the tree), while in the Parents pane, the call hierarchy is displayed in the reverse order (a routine that called another routine is displayed as a child of that routine’s node in the tree).
 |
When the Call Tree displays the Performance profiler results, it may contain fake call routes. For detailed information on this, see Tracing Call References - Peculiarities. |
Allocation Profiler
When the Allocation profiler is selected, the Call Tree displays either call routes for a class instance or the hierarchy of references between objects. The contents of the panel depend on the result category that is currently selected in the Explorer panel.
Classes Data
When the Classes Data category is selected for Allocation profiler results, you can use the Call Tree panel to trace how class instances were created. The panel consists of two panes: Parents and Children, but actually only the latter pane is used. The Children pane displays the tree of function calls that led to the creation of the class instances selected in the Report panel.
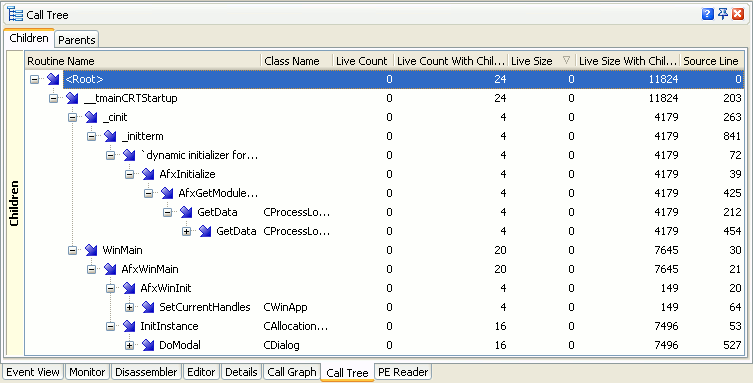
| Note: | The panel displays information only if the  View Allocation Paths in Call Tree button is pressed on the Report panel’s toolbar. View Allocation Paths in Call Tree button is pressed on the Report panel’s toolbar. |
Objects
When the Objects category is selected, the Call Tree panel consists of two panes: References From and References To.
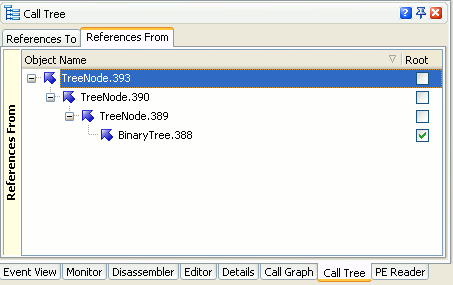
The References From pane displays the following tree of references between objects: what objects held references to the given object, what objects referred to these objects and so on.
The References To pane displays a different tree of references between objects: what objects the given object had references to, what objects these objects referred to and so on.
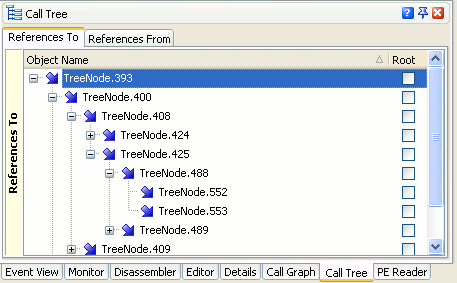
For the object chosen in Report, the panel displays all of the object references that were created during profiling.
Note that in both panes the object selected in the Report panel is the start node in the panes’ tree. As a result, these panes display their object reference trees in different chronological order. In the References To pane, object references are displayed in the direct order (an object that is referred to by another object is displayed as a child of that object’s node in the tree), while in the References From pane, object references are displayed in the reverse order (an object that refers to another object is displayed as a child of that object’s node in the tree).
For information on the panel’s columns, see Allocation Profiler - Call Tree Panel.
Function Trace Profiler
For the Function Trace profiler, when the Call Trace category is selected, the panel displays the call hierarchy for the routine that is currently selected in the Report panel. The Call Tree panel consists of two panes: Parents and Children. The Parents pane displays a tree of calls that led to the given routine being called.
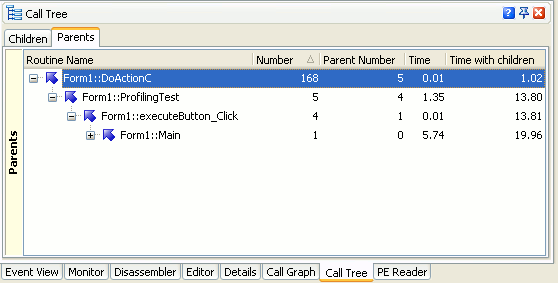
Similarly, the Children pane displays the tree of calls started by the given routine.
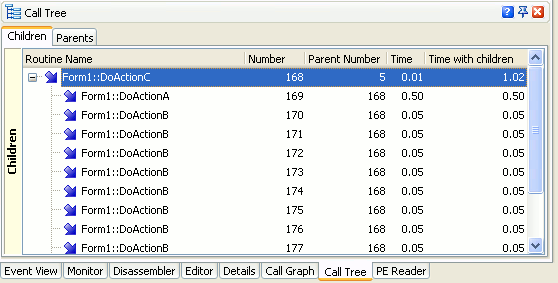
For the routine chosen in the Report panel, both panes display all the routes of routine calls that were used during profiling. So you can easily retrace the desired route.
Note that in both Parents and Children panes the routine selected in the Report panel is the start node of the panes’ trees. As a result, these panes display their call trees in different chronological order. In the Children pane, the call hierarchy is displayed in the direct order (a routine that was called by another routine is displayed as a child of that routine’s node in the tree), while in the Parents pane, the call hierarchy is displayed in the reverse order (a routine that called another routine is displayed as a child of that routine’s node in the tree).
For information on the panel’s columns, see Function Trace - Report Panel Call Trace Category.
Reference Count Profiler
For the Reference Count profiler, when the Objects category is selected, the Call Tree panel displays call routes for routines that create or release object references. The panel consists of two panes: Parents and Children, but actually only the latter is used. The Children pane displays a tree of calls that led to creation or deletion of references to the object chosen in the Report panel.
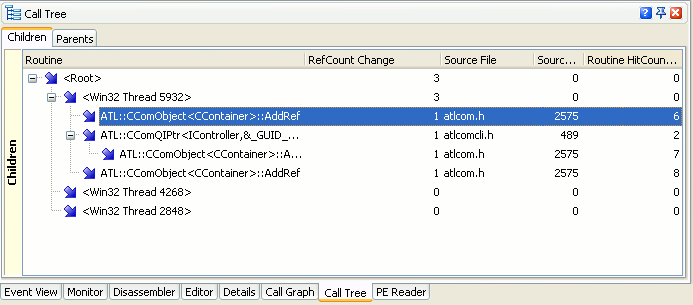
For information on the panel’s columns, see Reference Count Profiler - Call Tree Panel.
Static Analysis Profiler
When the Static Analysis profiler is selected, the Call Tree panel displays the hierarchy of potential call routes for the selected routine, or the hierarchy of class interlinks for the selected class. The contents of the panel depend on the category currently selected in the Explorer panel.
Routines Data
When the Routines Data category of Static Analysis results is selected, the Call Tree panel displays the hierarchy of potential routine calls in your application. The panel consists of two panes: Parents and Children:
-
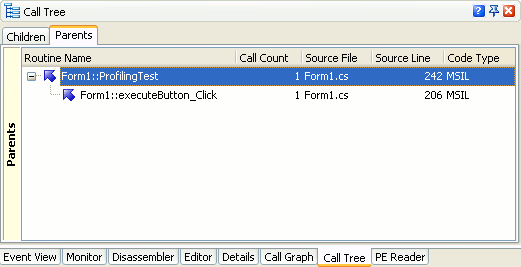
The Parents pane displays the hierarchy of function calls that can lead to the given routine :
-
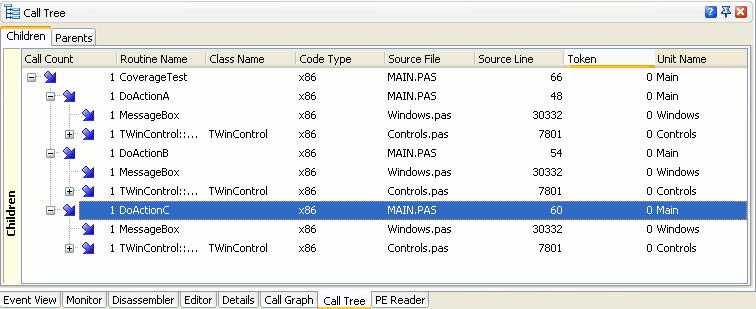
Similarly, the Children pane displays potential routine calls initiated from the selected routine.
Classes Data
When the Classes Data category of Static Analysis results is selected, the Call Tree panel shows the hierarchy of class interlinks. The information is displayed in two panes: Class Callers and Class Callees.
-
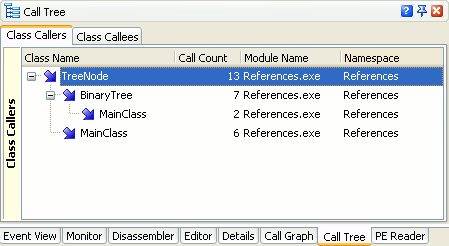
The Class Callers pane displays the hierarchy of classes whose methods eventually call methods of the currently selected class.
-
The Class Callees pane, it its turn, displays the hierarchy of classes whose method calls are initiated from the selected class.
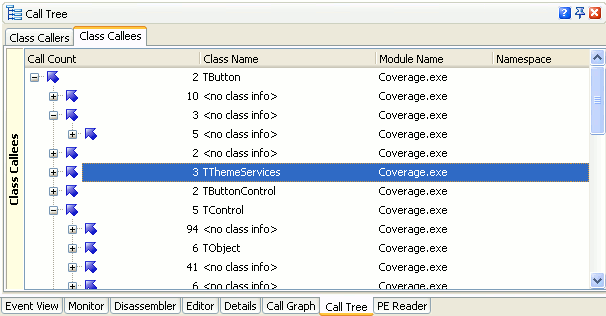
Note that in all the panes of the Call Tree panel (Parents, Children, Class Callers and Class Callees) the item selected in the Report panel is the start node of the panes’ trees. As a result, these panes display their call trees in different chronological order. In the Children and Class Callees panes, the call hierarchy is displayed in the direct order (the item that was called by another item is displayed as a child of that item in the tree), while in the Parents and Class Callers panes, the call hierarchy is displayed in the reverse order (the item that called another item is displayed as a child of that item in the tree).
For information on the columns the Call Tree panel contains, see Static Analysis Profiler - Call Tree Panel
See Also
Call Tree Panel
About the Call Tree Panel
Allocation Profiler - Call Tree Panel
Performance Profiler - Call Tree Panel
Reference Count Profiler - Call Tree Panel
Static Analysis Profiler - Call Tree Panel

 Performance Profiler