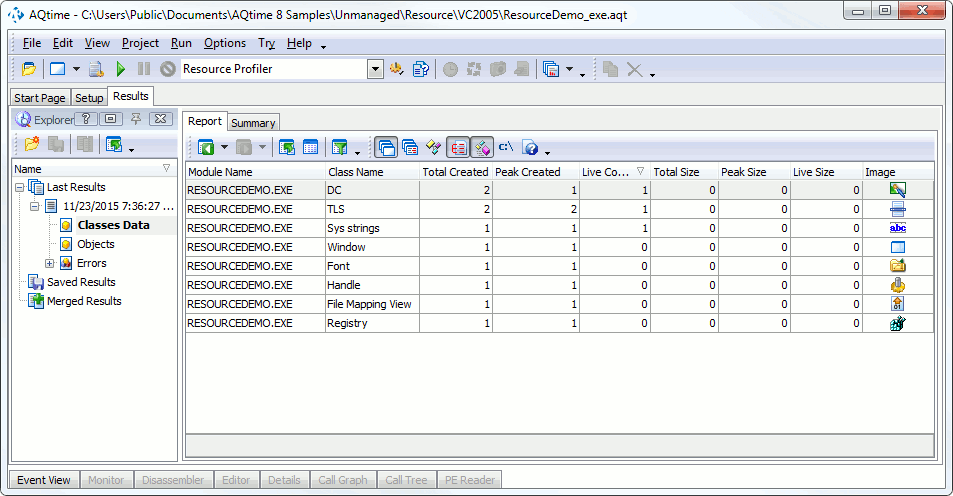
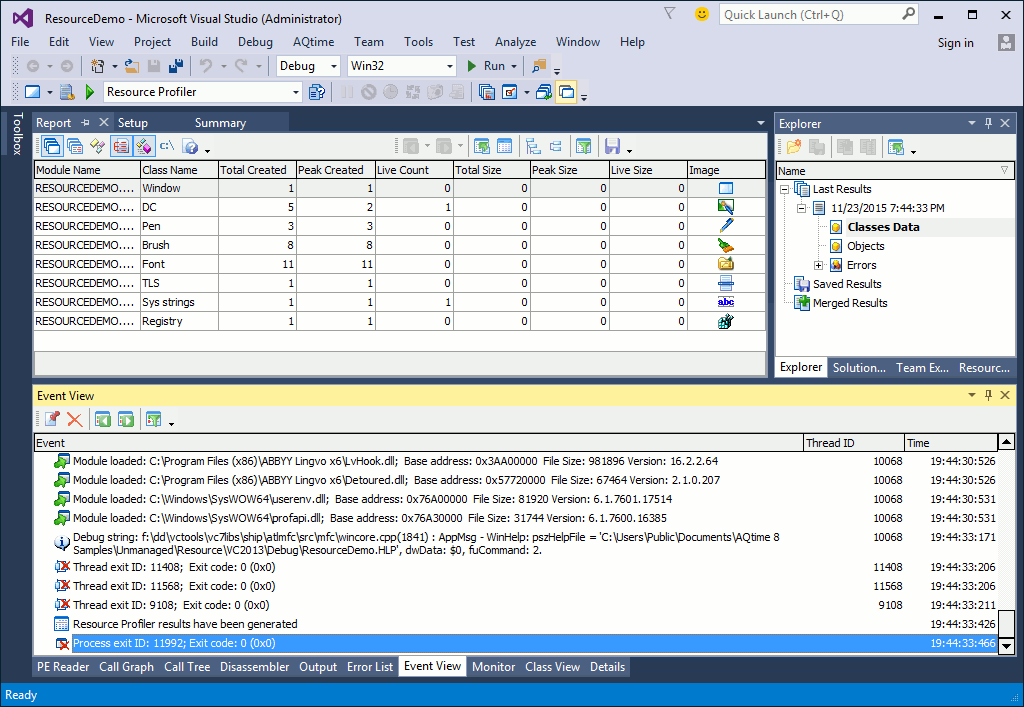
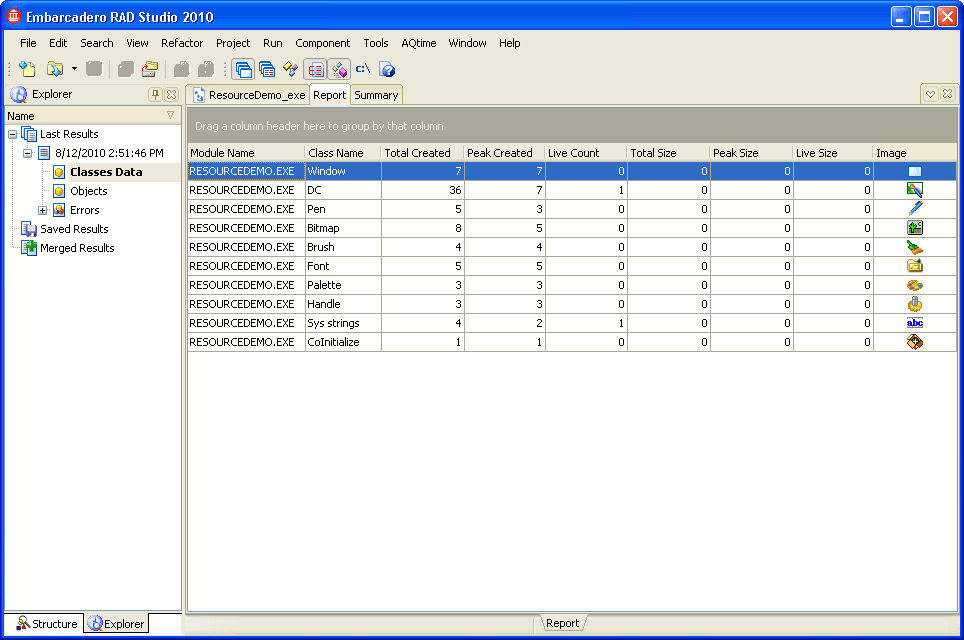
The Resource profiler results are divided into three categories: Classes Data, Objects and Errors. When the Classes Data category is selected, the Report panel displays information about the resource types whose instances were created during the run.
Below is a sample output of Resource profiler results displayed in the Classes Data category:
The following sections describe what information you can get from profiling results:
Viewing Profiling Results
Each row in the Report panel shows profiling results for every single resource type whose instances were allocated from the given module (for instance, if the profiled application created resources of the Handle type from two modules, e.g. msctf.dll and winmm.dll, the Report panel will have two records about this resource type, one for each module). These profiling results include the total and current number of resource instances, their size, etc. (For more detailed information, review Resource Profiler - Report Panel Columns.) This gives you a summary view on what happened with resources in the application during profiling (you can also view the summary results in the Summary panel).
| Tip: | By default, the Report panel holds only some of available columns. You can add more columns to the panel or remove columns from it. For more information on this, see Adding and Removing Columns. |
The footer of the Report panel column holds summary values for data displayed in that column. For instance, the footer of the Live Size column displays the summary size of all resource instances that existed at the moment of results generation. If you select two or more resource type records in the Report panel, the footer will show the summary values for the selected resource types only (for more information on how to select several rows in a panel, see Selecting Several Records in a Panel).
To determine if resource instances were existing at the moment of results generation, check the Live Count column value. If it is greater than 0, resource instances existed. If you obtain results upon closing the application, non-zero values in the Live Count column help you find resource leaks. To find them faster, you can sort or filter results on the Live Count column.
Specifics of Tracing Reallocation Functions
Note that if the Resource profiler encounters a call to a function that reallocates a resource that is already allocated (e.g. CoTaskMemRealloc, SysReAllocString, SysReAllocStringLen, etc.), the profiler “thinks” that this function deallocates the existing resource and allocates it anew (this is what really happens to this resource). Thus, the profiler increments the total number of resource instances of the corresponding type that were created during the run.
For instance, if you call the SysAllocString function to allocate a string, the profiler will inform you about one live resource instance of the Sys strings type. In this case, the total number of created resource instances of that type will be 1. Then, if you call SysReAllocString to reallocate that string, the Resource profiler will inform you that you still have one live resource instance of the Sys strings type, but the total number of created resource instances of that type will be 2.
See Also
Resource Profiler
Report Panel
Explorer Panel
Details Panel
Analyzing Profiler Results
Checking for Resource Links
Non-Existent Resources


 Viewing Profiling Results