You can add elements to profiling areas, triggers and actions directly from the Report panel. Actions and triggers can contain only routines. Profiling areas can include routines and classes as well as individual namespaces, modules, source files and units.
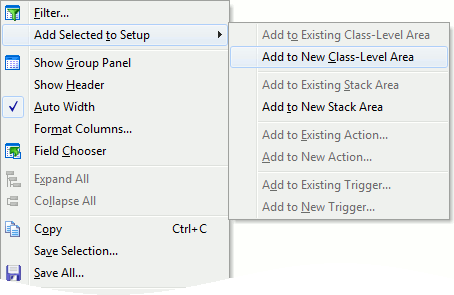
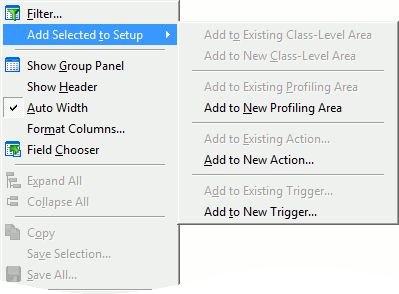
To add an element to a profiling area, trigger or action, select one or more rows in the Report panel and select Add Selected to Setup from the context menu. This will open another menu containing six items:


The Add to Existing Area, Add to Existing Action and Add to Existing Trigger commands display the Select Area, Select Action and Select Trigger dialogs respectively. In these dialogs, you can select an existing profiling area, action or trigger and add the selected elements to it.
The Add to New Area, Add to New Action and Add to New Trigger commands display the Add Area, Add Action and Add Trigger dialogs where you can create a new area, action or trigger and then add the selected elements to it.
These features let you easily separate the desired routines from other application functions and then profile the desired routines only. Suppose you run the Performance profiler against the entire application; you found several slow routines and want to profile them. In this case, you can select these routines in the Report panel, add them to a new profiling area via the Add to New Area command, uncheck other profiling areas in the Setup panel and then start a new profiler run. Creating a new profiling area from the Report panel is faster than creating a new area and adding the desired routines to it in the Setup panel.
| Note: | The above commands are applicable to classes, if the items displayed on each row of the Report panel are classes (for example, the results of the Allocation profiler), as opposed to routines. |
