Let’s create a new project and configure it to monitor the performance of your current computer under load:
-
To create a new project, select File > New > New Project from the LoadComplete main menu.
In the Create New Project wizard, specify the project name and location and click Finish.
LoadComplete will create the project and display its contents in the Project Explorer panel.
-
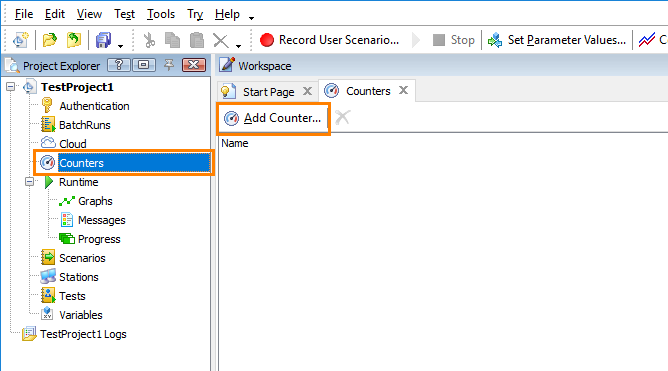
In the Project Explorer, double-click the Counters node to open the Counters page and click
 Add Counter on the page toolbar:
-
LoadComplete will open the Add Counter wizard. On the first page of the wizard, specify the server you want to monitor - in this tutorial it will be your current computer, that is, localhost:
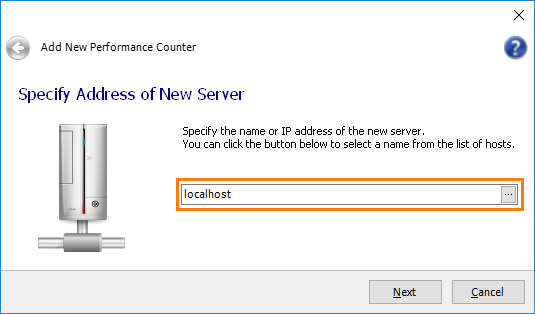
Click Next to continue.
-
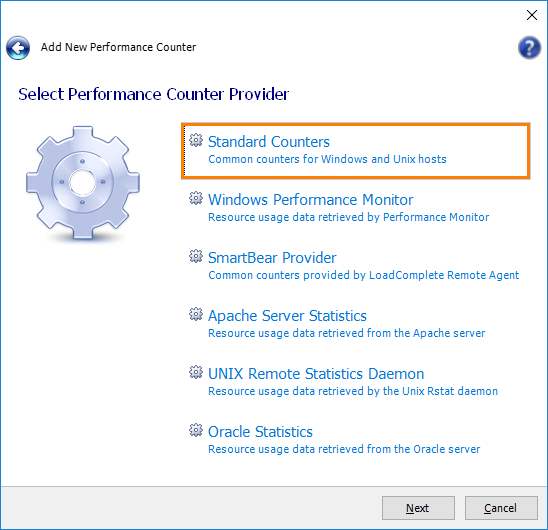
On the next page of the wizard, you select the performance data provider that will retrieve counters for your computer during the test run. Click Standard Counters:
-
The next page of the wizard lists four standard counters: % CPU, % Memory, Memory (MB) and % Disk Time. Select % CPU:
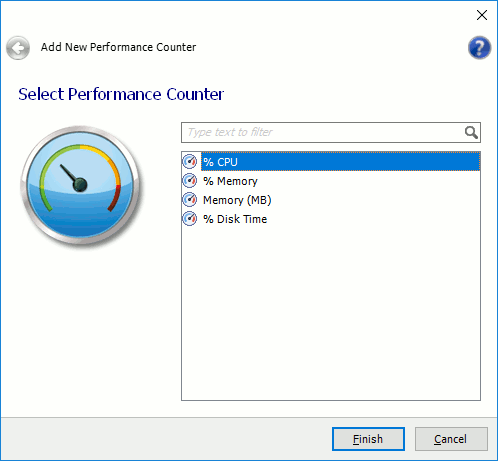
Click Finish to complete adding the counter.
-
LoadComplete will add the counter to the counter list.
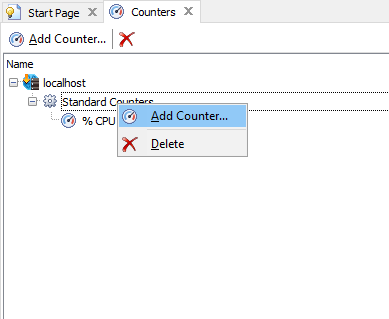
Let’s add another standard counter. Right-click the Standard Counters provider node on the page, and then click
 Add Counter:
-
LoadComplete will open the Select Performance Counter page of the Add Counter wizard. Select the Memory (MB) counter on it:
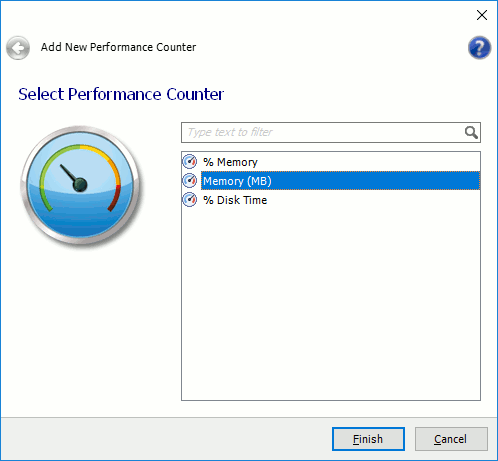
Click Finish. LoadComplete will add the counter to the counter list.
-
Now, we will add a custom counter, Requests/Sec, to the project. This metric will help us analyze how the number of requests executed per second changes under the load.
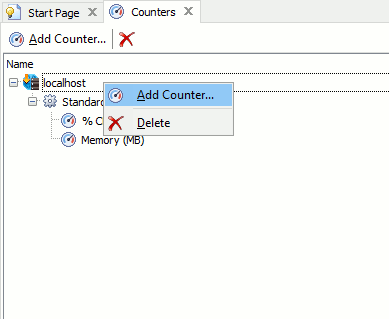
Right-click the localhost node in the counter list, and then click
 Add Counter:
-
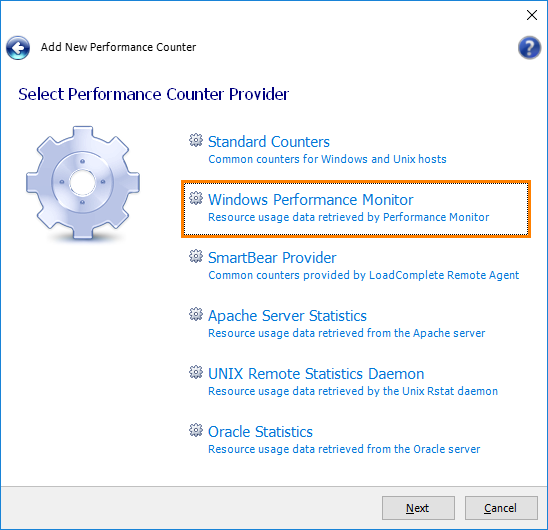
LoadComplete will open the Select a provider of performance counters page of the Add Counter wizard. Select Windows Performance Monitor:
-
On the next page of the wizard, enter Requests/Sec in the Quick Search text box to find the needed counter faster, expand the ASP.NET Apps v2.0.50727 > __Total__ node, and select the Request/Sec counter:
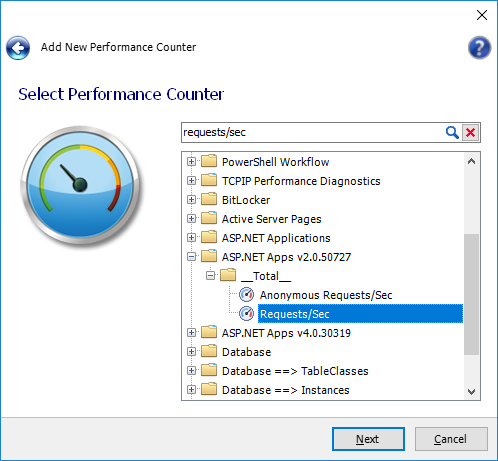
Click Next.
-
On the next page of the wizard, select measure units for the selected counter. In this case, it is Number per second:
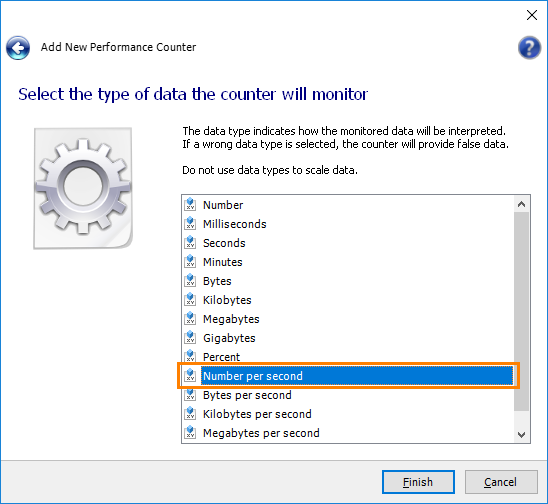
Click Finish.
-
LoadComplete will add the counter to the counter list:
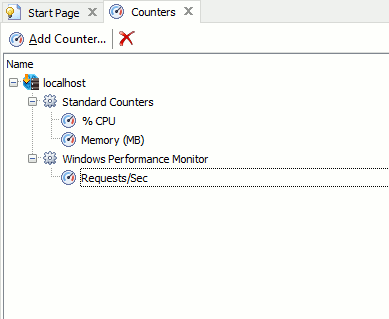
-
To monitor the added counters during the test run, let’s enable them on the Runtime > Graphs page.
Open the Runtime > Graphs page of your project and in the View drop-down list, select the Server performance view:
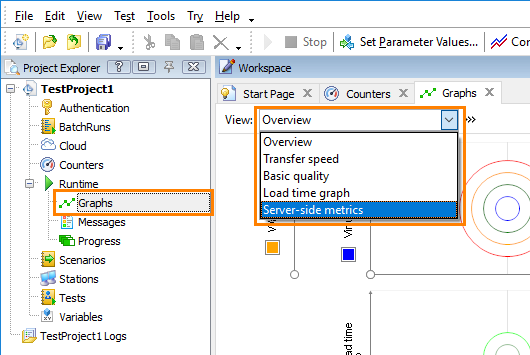
-
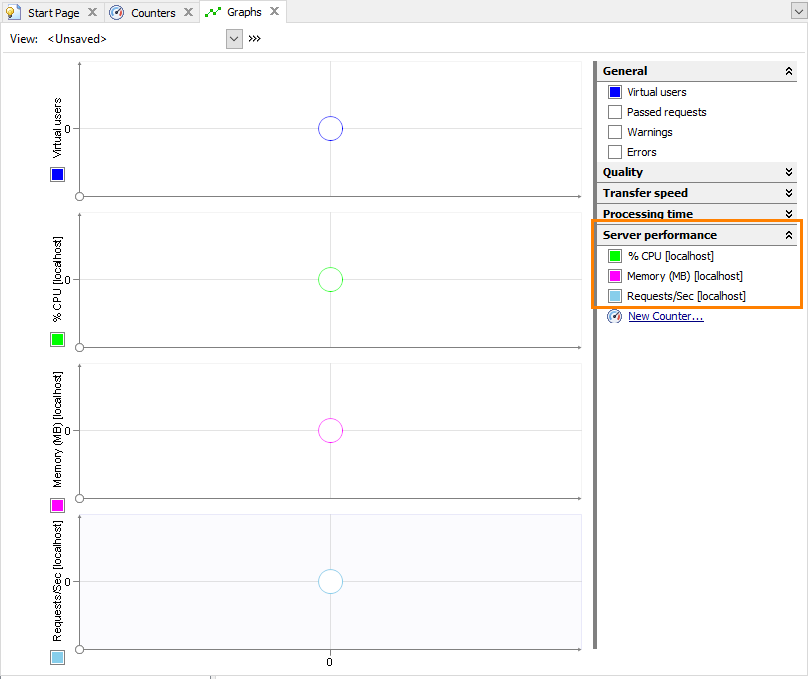
In the list of available counters in the right part of the page, locate the Server performance group. Enable the added counters:
LoadComplete will add the counters to the page.
Note: The Runtime > Graphs page contains no data and shows all the graphs as circles if you haven't run any test or scenario yet. -
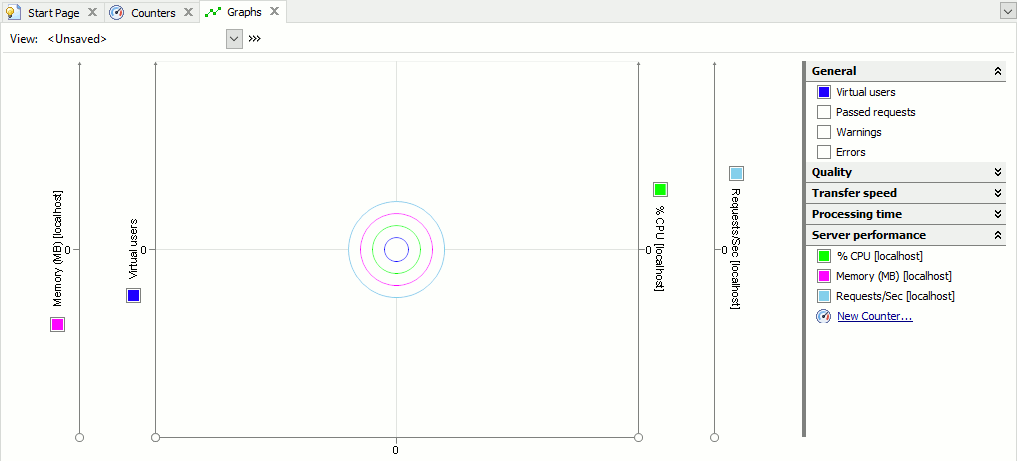
(Optional.) You can rearrange the counters to show them on a single graph:
See Also
Creating Test Projects
About Server Monitoring
Preparing Servers for Monitoring
Managing Server-Side Performance Counters

 Prev
Prev