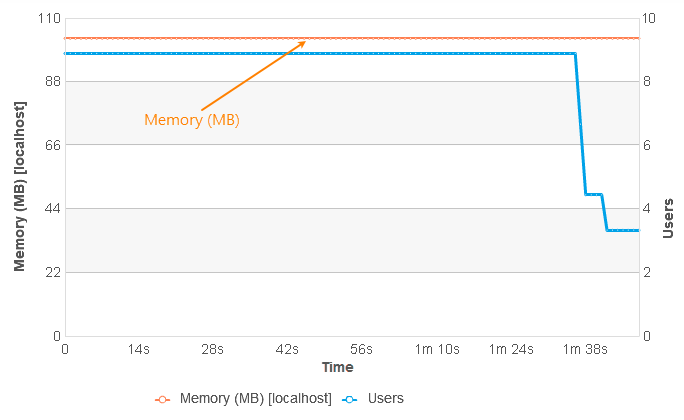
The Memory (MB) [Server_name] graph of the Report panel shows the relation between the number of virtual users, the Memory server-side metric and the test execution time. In other words, it shows how many users were simulated and how much memory (in megabytes) were used by the target server at any given moment of the test run.
Viewing the Graph
 |
To view the graph, add the Memory counter for the needed server to the Counters page of your project before you run the test. Otherwise, the test results will not show the graph after the test run is over. |
-
Open the desired Report item (if it is not open yet). To do that, expand the test log item node under the Project_Name Logs folder in the Project Explorer and double-click its child Report node.
-
In the Report panel, select the Infrastructure tabbed page.
-
Expand the Memory (MB) [Server_name] section.
Requirements
To view the graphs and charts shown in the Report panel, install Flash Player 8 or later for Windows Internet Explorer on your computer. You can download the latest version of the player from the Adobe web site:
Pages
The Memory (MB) [Server_name] section contains two tabbed pages that show memory usage statistics in different modes.
With Virtual Users Page
This page contains a graph that represents both the number of virtual users and the amount of memory used at any moment of the test run. A sample view of the graph is as follows:

If you simulated load profile or continuous load on the server, this graph may look a bit different.
Note that the graph includes the amount of used memory obtained during the test run (these values are shown on the Runtime > Graphs page of the project at runtime). You can also filter which relations are shown on the graph simultaneously. To hide a line, click the appropriate icon under the graph.
To see the exact value of a metric at a specific moment, hover the mouse pointer over the needed data point on the graph – the metric value will be shown in a tooltip.
Printing the Contents of the Report Panel
Note that LoadComplete shows the data shown in the graph in the tabular format. An appropriate table is shown under the Memory (MB) [Server_name] graph when you start printing the contents of the Report panel, that is, when you click Print on the panel's toolbar.
The above-mentioned table contains the following columns:
| Column | Description |
|---|---|
|
Time |
Contains time values from 0 to the test execution time in increments of one second. |
|
Memory (MB) [Server_name] |
Contains the amount of memory used at the specified moment. |
|
Users |
Contains the number of virtual users that were simulated at the specified moment. |
More Information
For more information on working with the graphs and charts shown in the Report panel, see Viewing the Report Charts and Graphs.
Scroll Chart Page
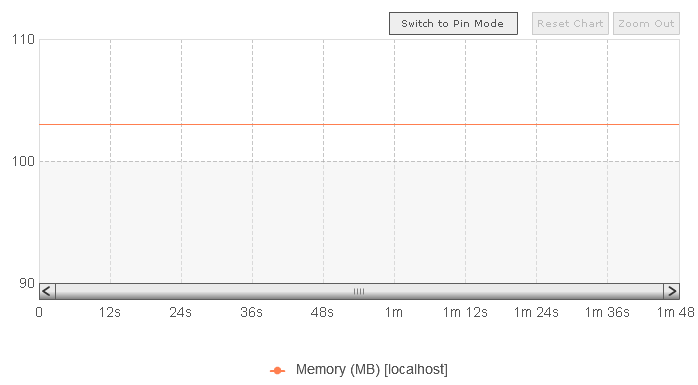
This page contains a graph that represents the amount of memory used at any moment during the test run. A sample view of the graph is as follows:

Note that the graph includes only the exact amount of memory obtained during the test run (these values are shown on the Runtime > Graphs page of the project at runtime).
You can zoom this graph in and out. You can also select the desired area of the graph and then overlay it with another area. For more information on working with scroll graphs, see Working With Scroll Graphs.
Data Table Page
This page contains a table that represents the data of the graphs displayed on the With Virtual Users page. For a detailed description of its columns, refer to the description of the graphs.
 |
This tab is not visible in LoadComplete. To view its contents, export your test results to an external file. |
See Also
Viewing Server Monitoring Graphs
Server Monitoring Section
Infrastructure Page of the Report Panel
Report Panel
About Test Results
Typical Response Codes
Resolving Errors and Warnings

