
This topic explains how to work with the scroll graphs shown in the Report panel of the test log. You can change the scale of the scroll graphs, compare different parts of a graph with each other and so on. To view a scroll graph, do the following:
-
Open the desired Report item. For this purpose, double-click the Report node under the needed log item’s node in the Project Explorer panel.
-
In the Report panel, switch to the desired tabbed page (the scroll graphs are shown on the Pass / Fail, Response Time and Infrastructure pages).
-
Expand the desired section and then switch to the Scroll chart tabbed page.
To view the graphs and charts shown in the Report panel, install Flash Player 8 or later for Windows Internet Explorer on your computer. You can download the latest version of the player from the Adobe web site:

The topic contains the following sections:
Viewing modes
You can work with scroll graphs in two predefined modes:
-
Pin mode - this mode lets you compare the desired part of a graph with other parts. This means that you just select an area of the graph, then drag it to another part of the graph and compare the metric values visually.
-
Zoom mode - this mode lets you zoom the graph in and out to view the desired areas closer.
Note that these modes are mutually exclusive. In other words, you cannot use two modes simultaneously. For more information on each mode, see the sections below.
1. Pin mode
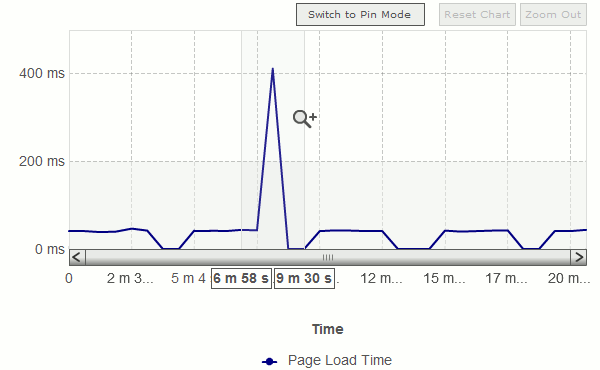
The Pin mode lets you compare different parts of a graph with each other. To start working with this mode, you need to activate it first. For this purpose, you can either click the Switch to Pin Mode button above the graph or select Switch to Pin Mode from the graph’s context menu.
| Note: | If the Switch to Zoom Mode button (or the context menu item) is already available, the Pin mode is currently active. |
After the mode is activated, you can overlay the desired part of the graph with another part. For this purpose, do the following:
-
Select the desired area of the graph with the mouse pointer. After you release the mouse button, the selected area will be highlighted with the grey color:
-
Drag the highlighted area to the desired part of the graph. After that, LoadComplete will overlay the selected area with the desired part so you can see the difference between the displayed values. Note that the selected part of the graph is shown as a dash line after you drag it to another part of the graph:
-
To remove the selection, click the X button at the top of the highlighted area.
2. Zoom mode
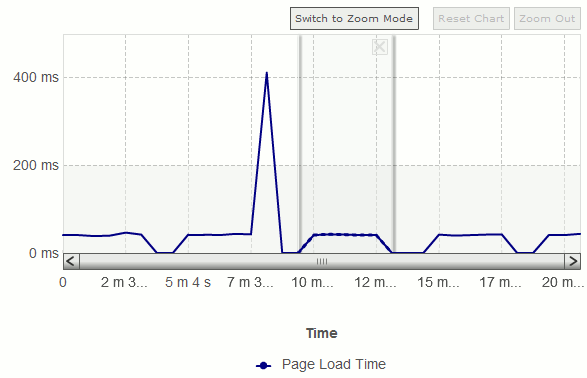
The Zoom mode lets you scale the graph as you wish. To start work with this mode, you need to activate it first. For this purpose, you can either click the Switch to Zoom Mode button above the graph or select Switch to Zoom Mode from the graph’s context menu.
| Note: | If the Switch to Pin Mode button (or the context menu item) is already available, the Zoom mode is currently active. |
After the mode is activated, you can zoom the graph in and out. For this purpose, do the following:
-
Select the desired area of the graph with the mouse pointer.
-
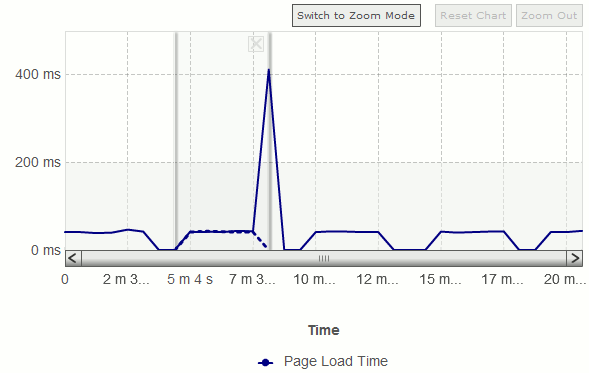
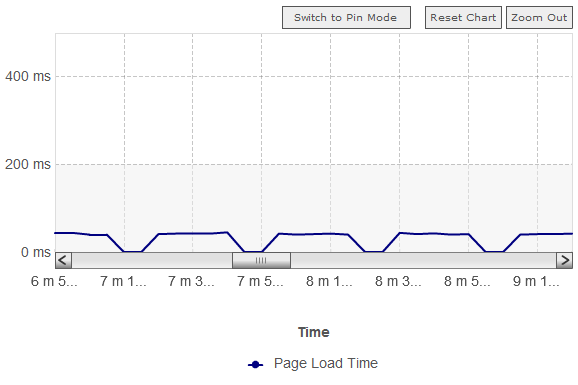
Release the mouse pointer and LoadComplete will stretch the selected area to fit the entire graph window.
-
To zoom the graph out, you can either click the Zoom Out button above the graph or select Zoom Out from the graph’s context menu.
To restore the graph’s view, you can either click the Reset Chart button above the graph or select Reset Chart from the graph’s context menu.
| Note: | If you zoom the graph in and then switch to the Pin mode, the scale will be the same as it was in the Zoom mode. In other words, LoadComplete does not restore the graph’s scale when you change the view mode.
The more you zoom the graph in, the more “real-life” statistics you see. That is, when the graph is zoomed out, it is automatically smoothed and some statistics may be lost. |
Common tasks
This section provides you with common tasks that you can perform over the scroll graphs.
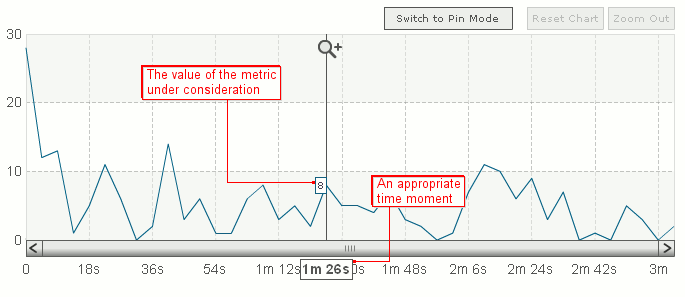
As the scale of a graph may be too small, it can be difficult to obtain the exact value of the metric under consideration at certain moment. In this case, you can move the mouse pointer over the graph and LoadComplete will show the exact value of the metric and the corresponding time in special boxes on the graph.
Note that the feature described above is available in each of the two viewing modes.
For more information on the tasks that you can perform over scroll graphs, see the table below.
| How to… | Solution |
|---|---|
| Zoom the graph in | Activate the Zoom mode and select the desired area of the graph. After you release the mouse button, LoadComplete will stretch the selected area so that it takes the entire graph window. |
| Zoom the graph out | Activate the Zoom mode and click the Zoom Out button above the graph. As an alternative, you can select Zoom Out from the graph’s context menu. |
| Restore the graph’s view | Activate the Zoom mode and click the Reset Chart button above the graph. As an alternative, you can select Reset Chart from the graph’s context menu. |
| Scroll the chart | You can either use the scroll bar at the bottom of the graph or you can place the mouse pointer over the scroll bar and then rotate the mouse wheel to scroll the graph. |
| Overlay one part of the graph with another | Activate the Pin mode, select the desired area and then drag it to the desired part of the graph. |
| Hide a line shown on the graph | Click the hint under the graph. To show the line again, click the hint one more time. |
For more information on the basic concepts of working with the graphs and chart shown in the Report panel, see Viewing Report Charts and Graphs.
See Also
Report Panel
Viewing Report Charts and Graphs
About Test Results