
AQTime collects almost the same information for unmanaged routines as it did for managed routines. As you can see in the picture below, the Report panel holds the results of both types of routines. And the Details or Call Graph panels also make no differentiation between unmanaged and managed routines.

Click the image to enlarge it.

Click the image to enlarge it.

Click the image to enlarge it.
To distinguish between managed and unmanaged routines in the results, add the Code Type column to the panel (see Adding and Removing Columns). This column indicates if the given routine is managed or unmanaged. For managed routines this column holds the MSIL value, for unmanaged - x86 or PInvoke.

Click the image to enlarge it.

Click the image to enlarge it.

Click the image to enlarge it.
Let's filter results to display the managed routines only:
- Select
 Filter from the Report context menu. This will open the Filter Dialog.
 - Use this dialog to create the following filter condition:
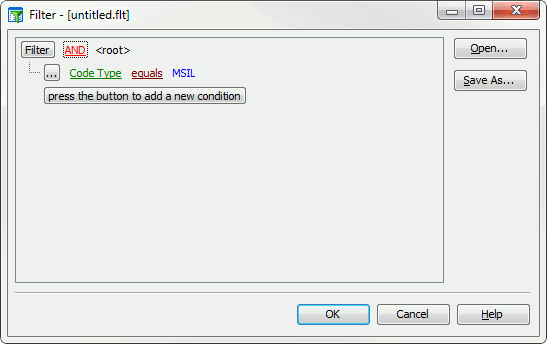
- Press OK to apply the filter.
Now, the report panel only displays profiling results for the managed code:

Click the image to enlarge it.

Click the image to enlarge it.

Click the image to enlarge it.
 Prev
PrevSee Also
Profiling Managed and Unmanaged Code
Analyzing Profiler Results
Filtering Results
Adding and Removing Columns