
To demonstrate the profiling of mixed code, we will use the MixedSample application.
.NET application
Microsoft Visual Studio 2005 projects:
 <AQTime Samples>\Managed\VS2005\MixedProfiling\Managed\CS - Microsoft Visual C# .NET
<AQTime Samples>\Managed\VS2005\MixedProfiling\Managed\VB - Microsoft Visual VB .NET
<AQTime Samples>\Managed\VS2005\MixedProfiling\Managed\VC - Microsoft Visual C++ .NET
<AQTime Samples>\Managed\VS2005\MixedProfiling\Managed\JS - Microsoft Visual J# .NET
Microsoft Visual Studio 2013 projects:
<AQTime Samples>\Managed\VS2013\MixedProfiling\Managed\CS - Microsoft Visual C# .NET
<AQTime Samples>\Managed\VS2013\MixedProfiling\Managed\VB - Microsoft Visual VB .NET
<AQTime Samples>\Managed\VS2013\MixedProfiling\Managed\VC - Microsoft Visual C++ .NET
Native-code DLLs
<AQTime Samples>\Managed\VS2013\MixedProfiling\Unmanaged\VC2013 - Microsoft Visual C++ 2013
<AQTime Samples>\Managed\VS2005\MixedProfiling\Unmanaged\VC - Microsoft Visual C++ 7.x
<AQTime Samples>\Managed\VS2005\MixedProfiling\Unmanaged\VC2005 - Microsoft Visual C++ 2005
<AQTime Samples>\Managed\VS2005\MixedProfiling\Unmanaged\Delphi - Borland Delphi
| Note: | You can also open Visual Studio samples in later versions of Visual Studio. |
 |
On Windows Vista and later, AQTime samples are located in the <Users>\Public\Documents\AQTime 8 Samples folder. On other operating systems, the samples reside in the <Documents and Settings>\All Users\Documents\AQTime 8 Samples folder. |
To profile this example with AQTime, do the following:
-
Open the compiled executable (MixedSample.exe) in AQTime.
-
Select
 Add Module from the context menu of the Setup panel and load either Visual C++ or a Delphi DLL in AQTime.
 -
Enable All Project Modules (Routines only) or All Project Modules (Collect info about lines) and disable Entire .NET Code in the Setup panel. (Review About Areas for the details of defining areas and selecting the code to profile.)
-
Select Performance Profiler from the Standard toolbar.
Select the Performance Profiler from the Profiler drop-down list in the AQTime menu.
Select the Performance Profiler from the Current Profiler submenu in the AQTime menu.
-
Select
 Normal from the Profiling Mode drop-down list box that is displayed on AQTime’s Standard toolbar.
Select
Normal from the Profiling Mode drop-down list box that is displayed on Visual Studio’s AQTime toolbar.Click the
Normal button on RAD Studio’s AQTime Profiling Modes toolbar. -
Verify that the
 Enable/Disable Profiling button is pressed since AQTime only profiles when enabled.
 -
Press
 Run on the Standard toolbar to start profiling.Select AQTime > Run from Visual Studio’s menu to start profiling. Alternative way to start profiling is to press Visual Studio’s
  Run button while any of AQTime panels is active.Select AQTime > Run With Profiling from Embarcadero RAD Studio’s menu to start profiling. AQTime will launch the profiled application:
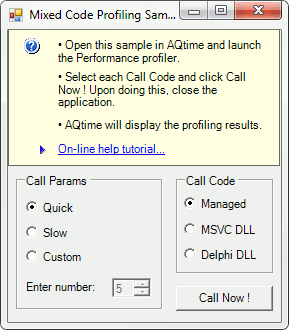
-
Now let’s call the managed code routines:
-
Select Quick from the Call Params group and press Call Now !
-
Select Slow and press Call Now ! one more time.
-
Select Custom and again press Call Now !
-
-
We have called the managed code routines. Now let’s call the unmanaged routines:
-
In the Call Code group select either MSVC DLL or Delphi DLL.
-
Select Quick from the Call Params group and press Call Now !
-
Select Slow and press Call Now !
-
Finally, select Custom and again press Call Now !
-
-
Close the application.
 Prev
Prev