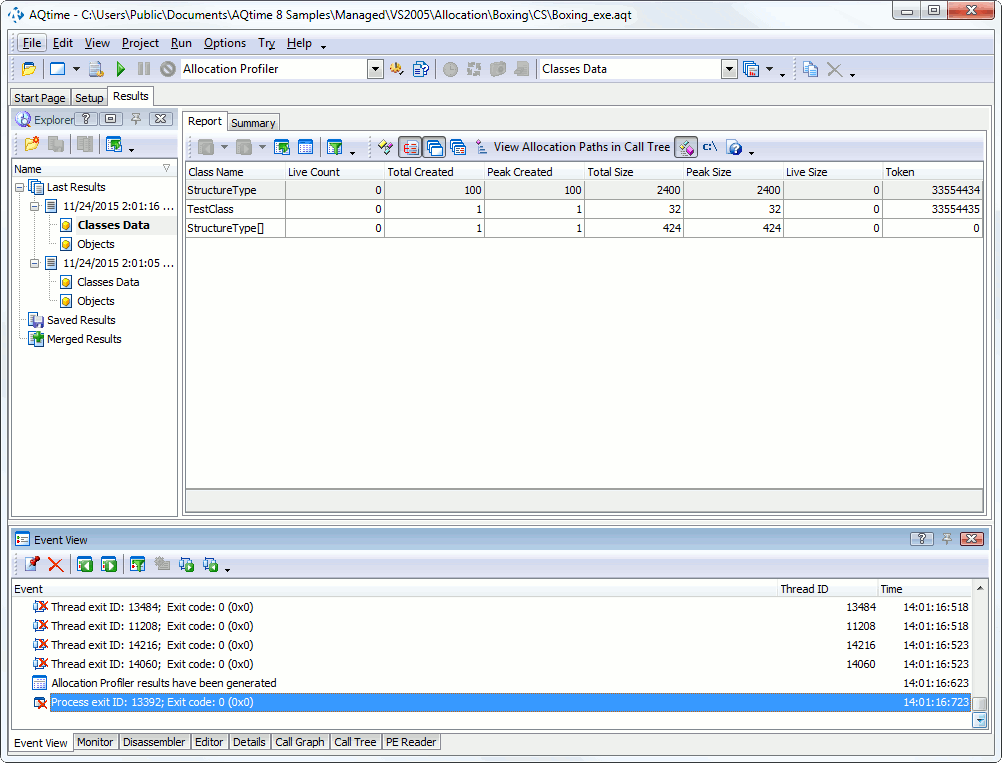
The Explorer panel displays two result sets: one result set was generated upon closing the profiled application and another set of results was generated when you pressed the  Get Results button. The results that were generated upon closing the profiled application hold no leaked objects. This is true: since we profiled a managed application, the Common Language Runtime released all the memory allocated by the application:
We will work with the results that were generated upon pressing the Get Results button. Select this set of results in the Explorer panel. AQTime will update its panels so that they will display the selected results.
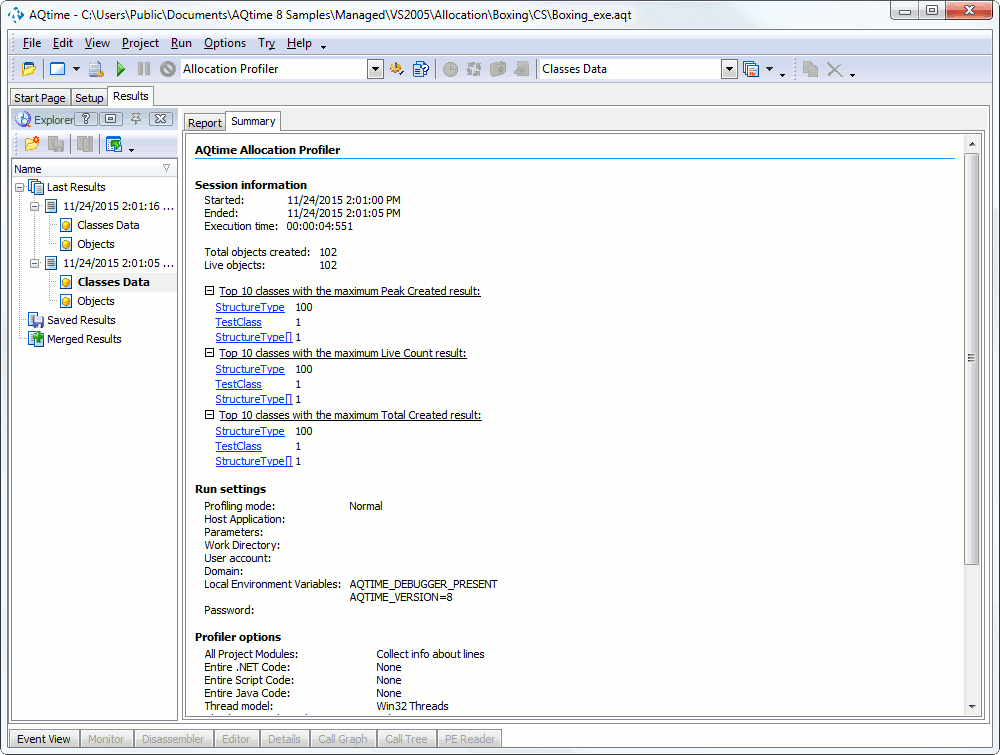
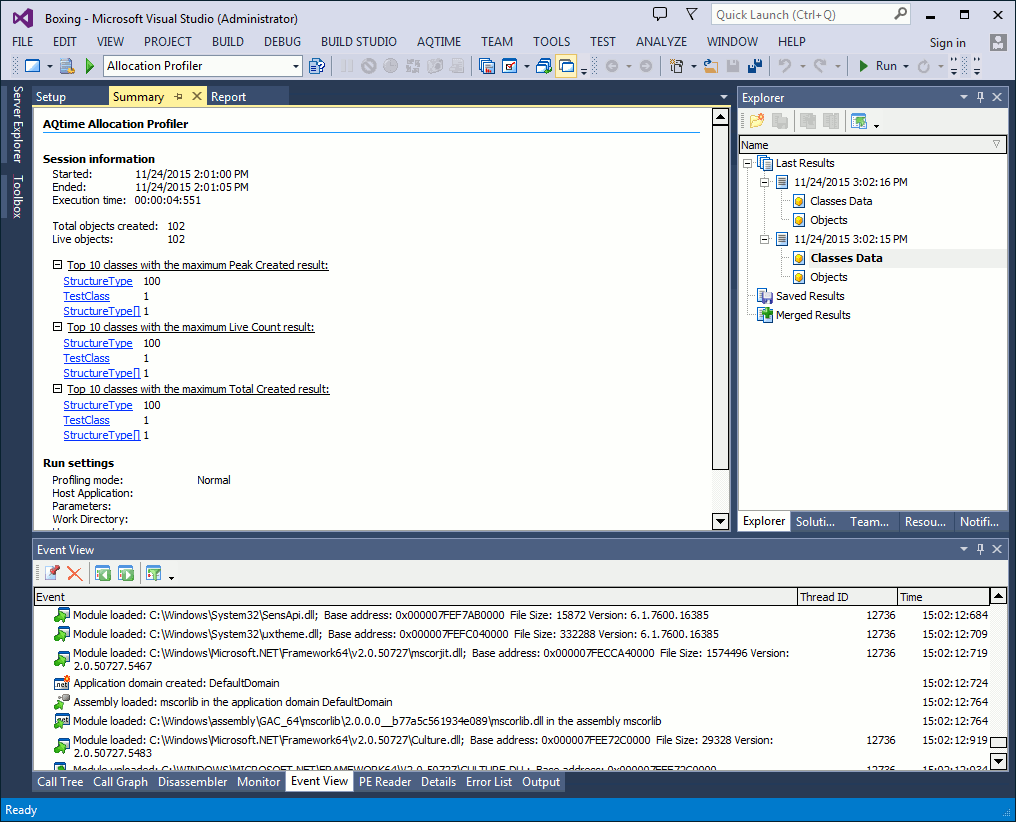
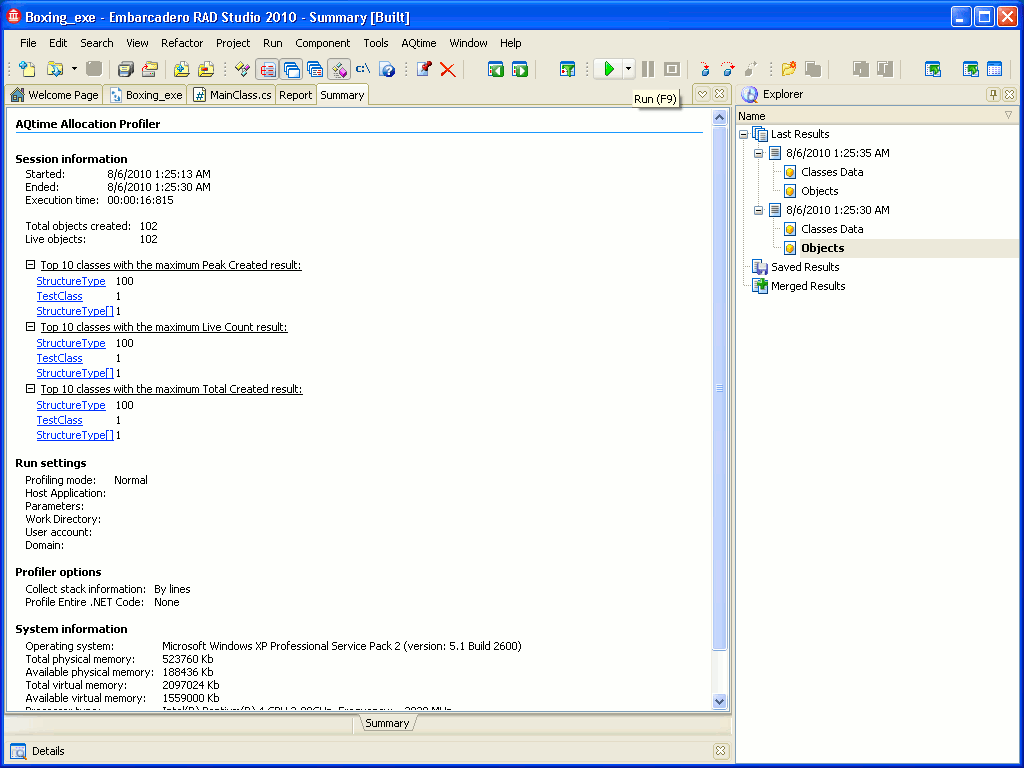
The Summary panel provides the summarized statistics on the entire profile run, for instance:
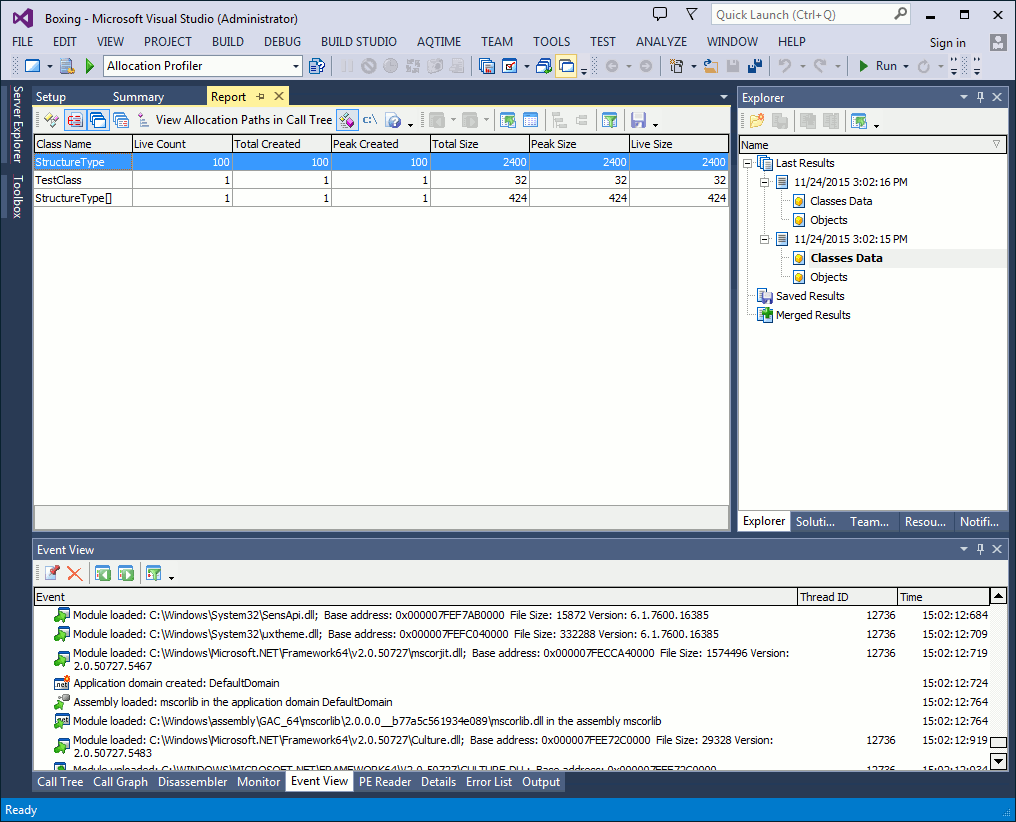
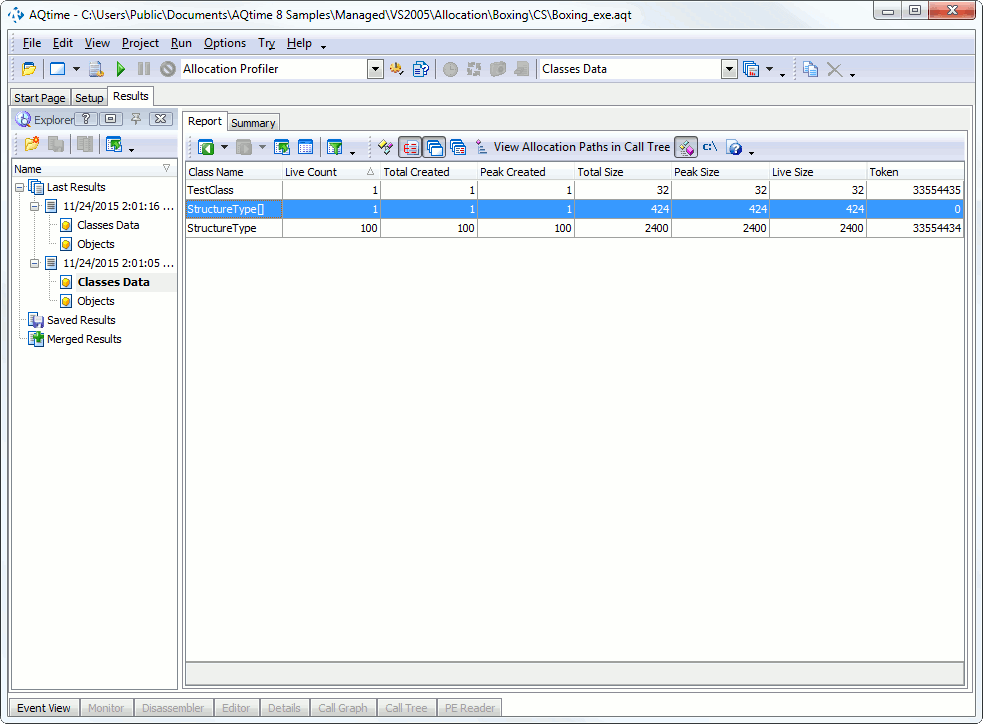
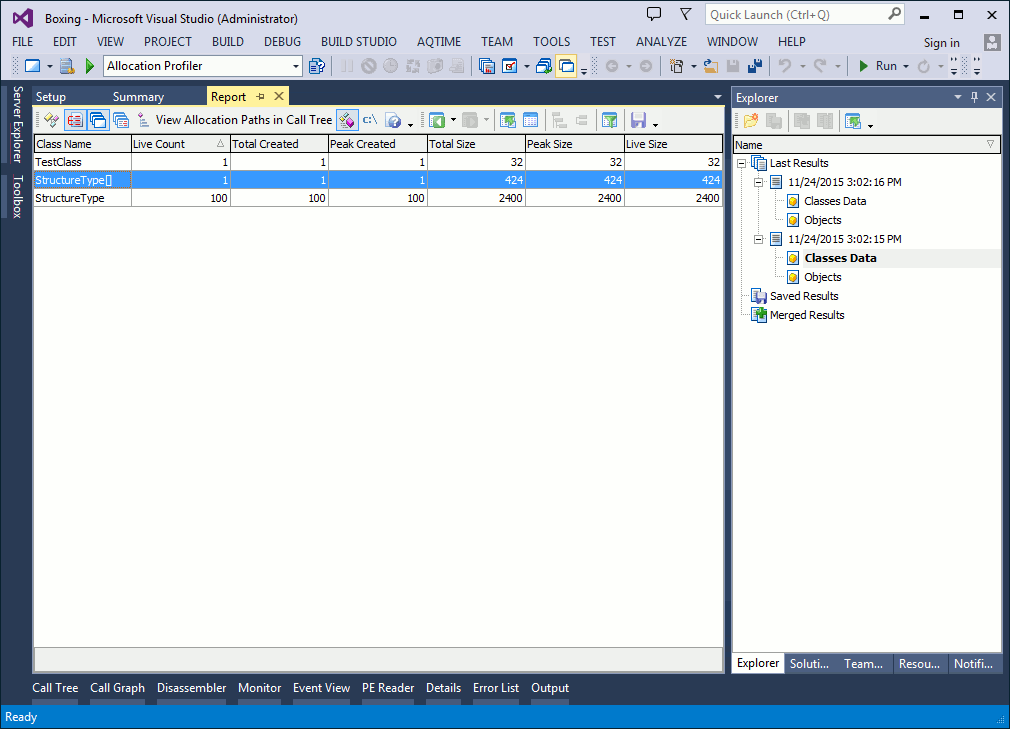
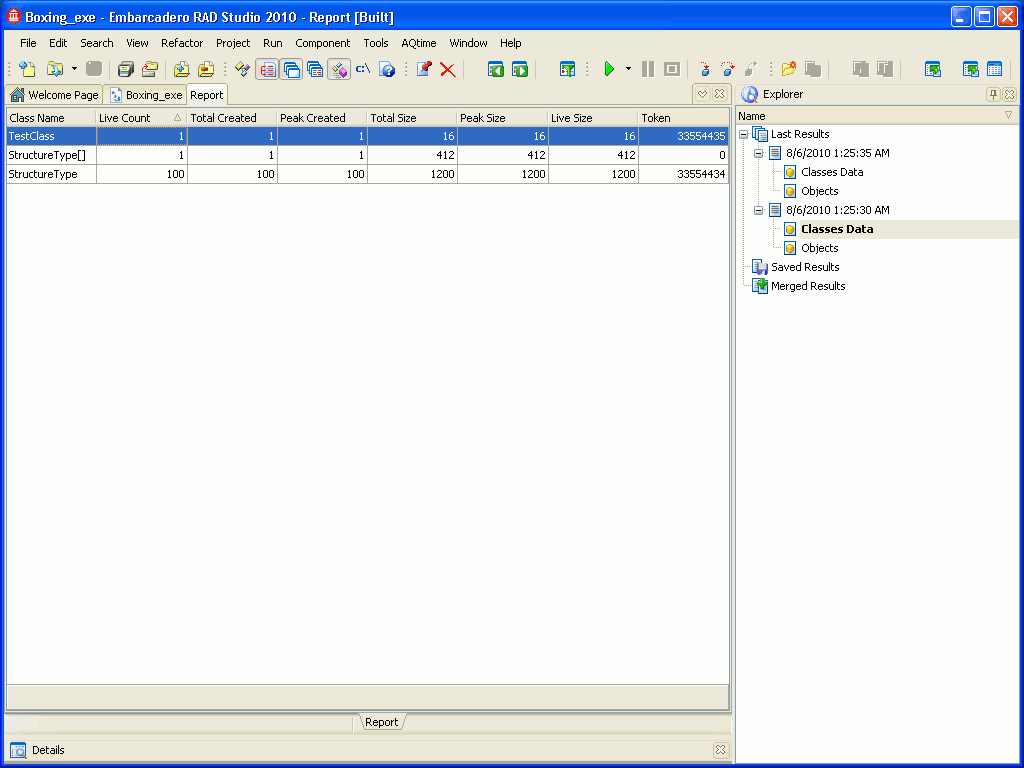
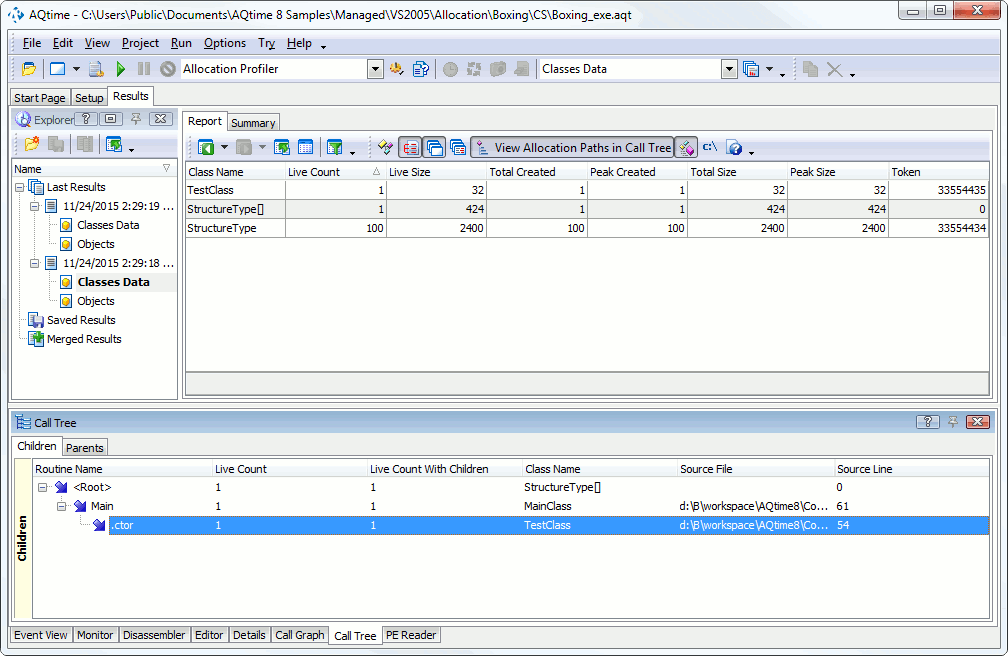
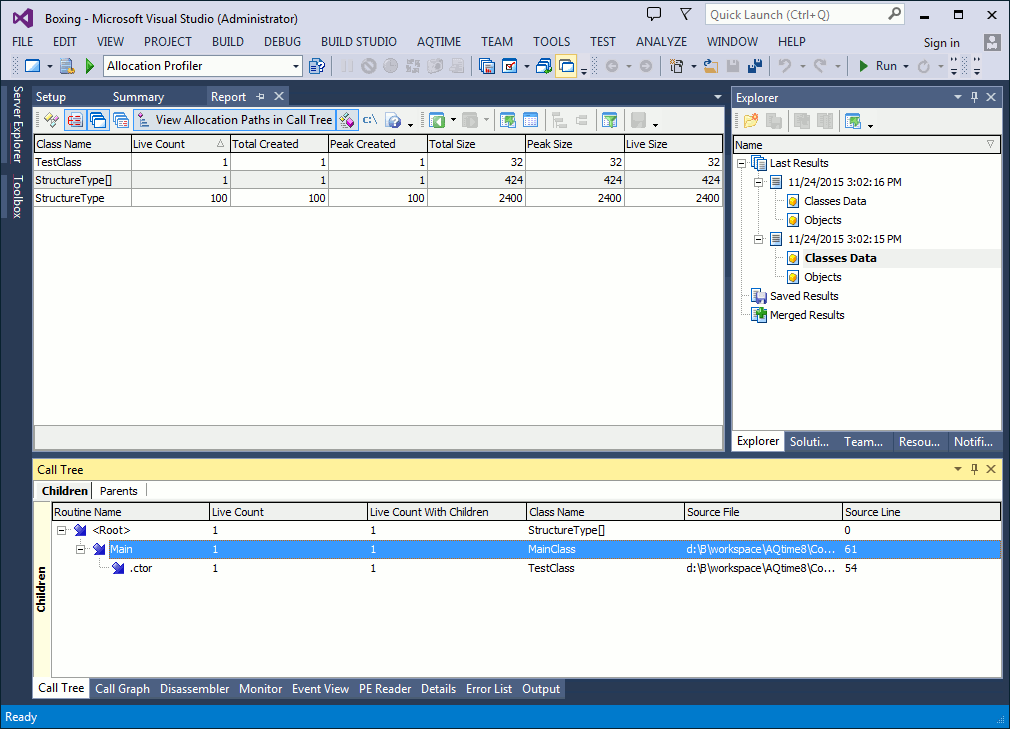
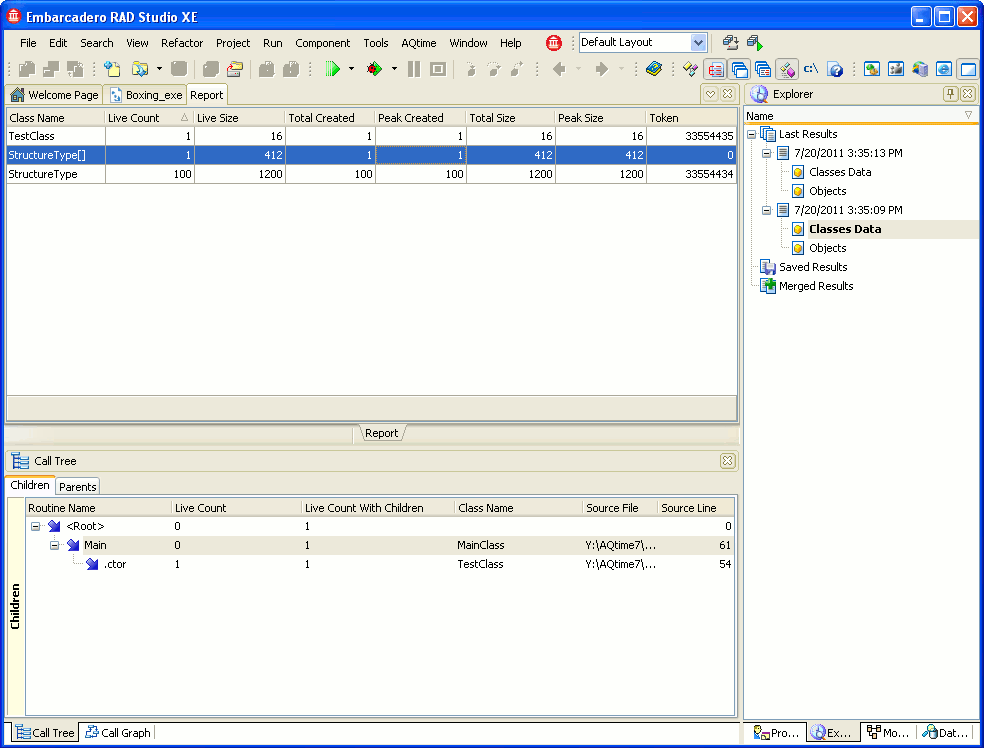
The contents of the Report panel depend on the results category that is selected in the Explorer panel. If the Classes Data category is selected, the Report panel shows a list of classes that were created during the application execution:
Take a look at the Live Count column. It displays the number of class instances that currently exist in memory. Since the profiler collects statistics just before the final garbage collection occurs, the Live Count values are the number of instances that were not freed by the application itself (if you want, you can rely on the garbage collector to release those resources).
As you can see in the Report panel, the application created and did not free 102 objects: an instance of the TestClass class, an array of StructureType instances (denoted as StructureType[]), and a hundred of separate StructureType instances. Pay attention to the fact that a class (e.g. StructureType) and an array of instances of this class (StructureType[]) are treated as separate classes in AQTime.
Let’s have a closer look at the StructureType[] instance. Select the StructureType[] row in the Report panel and then switch to the Call Tree panel:
The Call Tree panel displays a sequence of function calls that led to creation of the instance selected in Report. The node whose Live Count value is greater than 0 is the very function that created the given object.
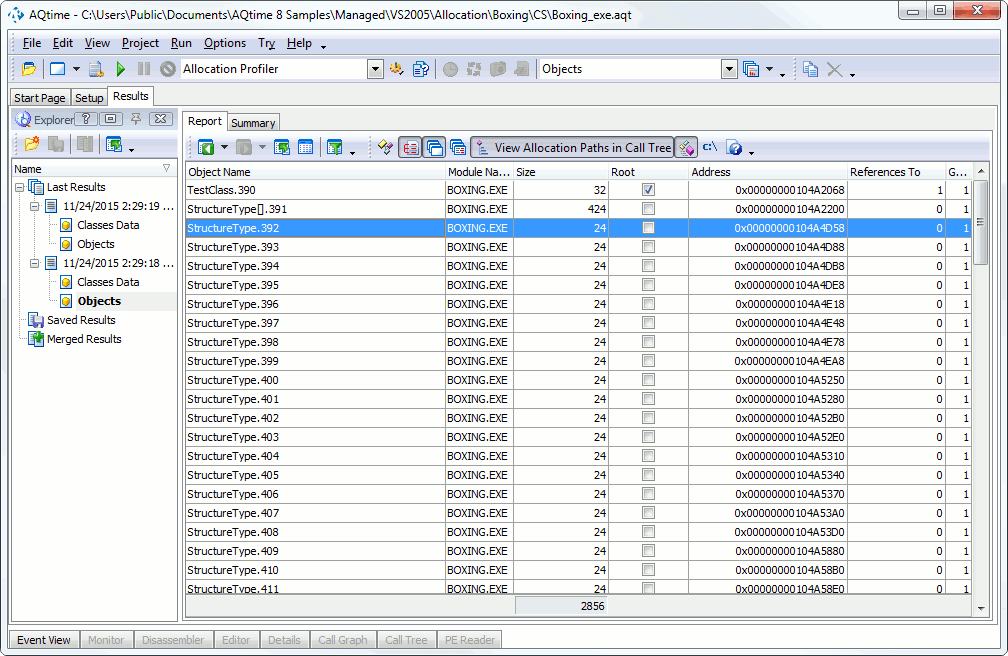
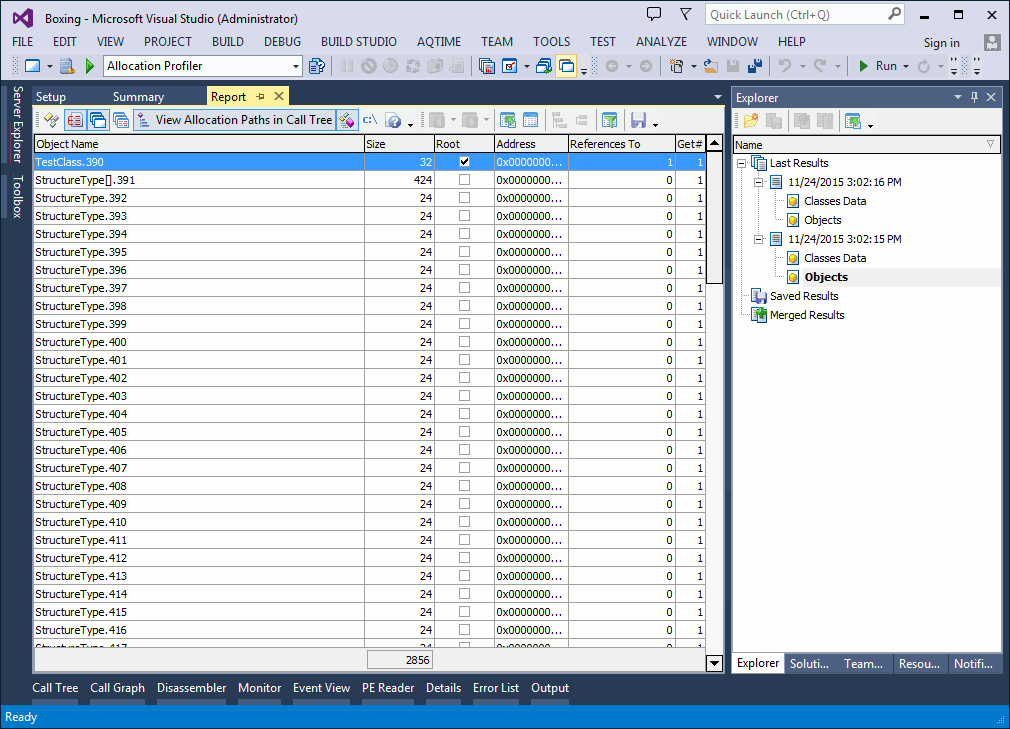
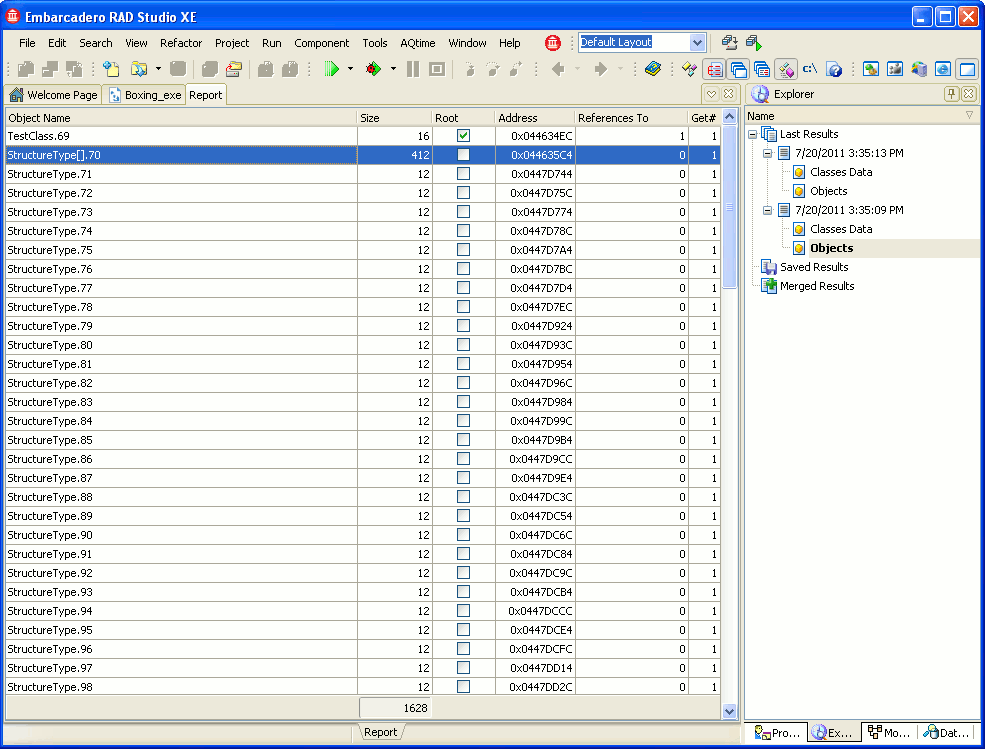
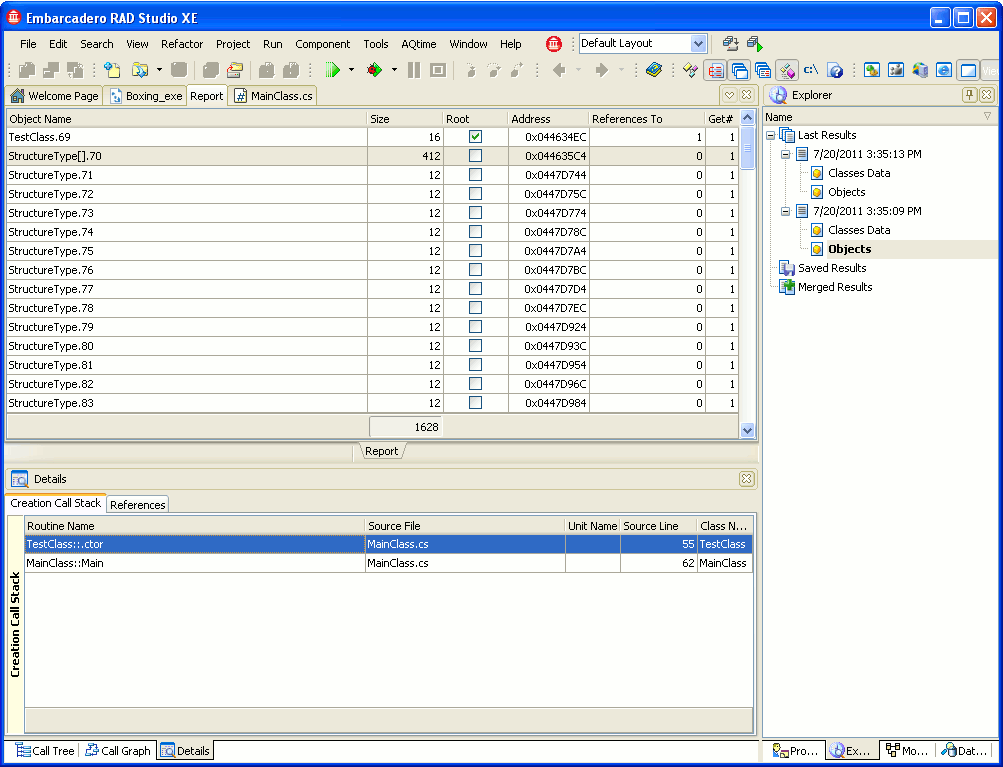
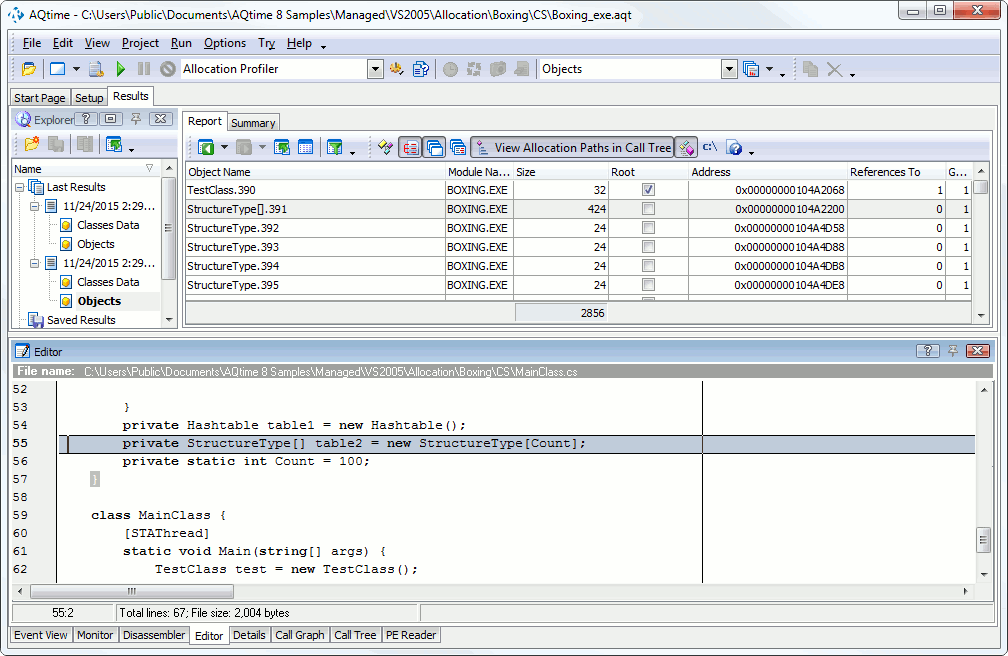
When you select the Objects category in the Explorer panel, the Report panel displays the results for individual unreleased objects. These are numerous object instances that are reported in the class list:
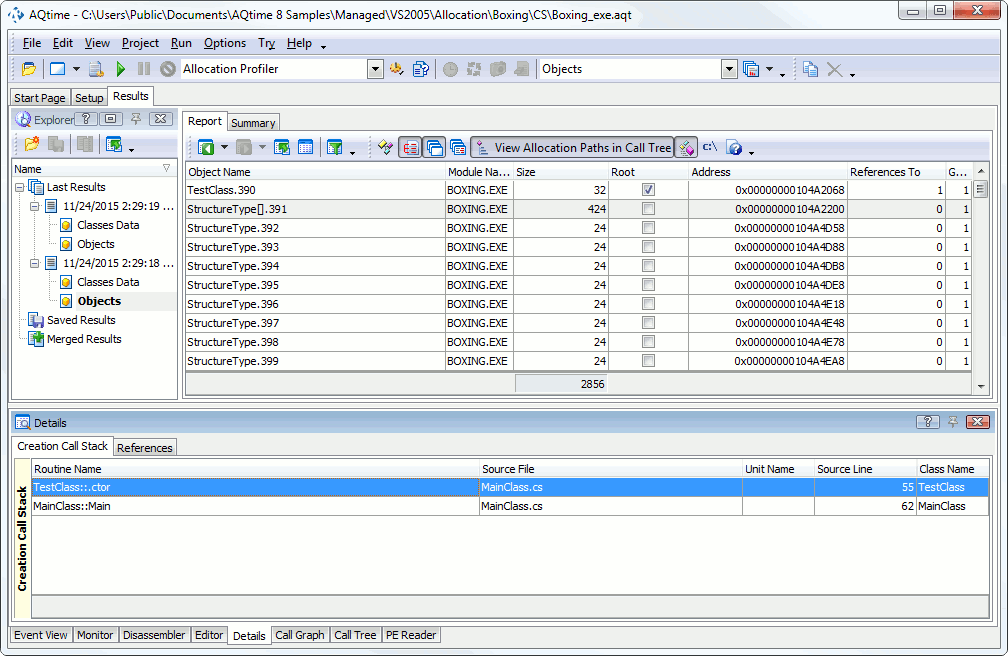
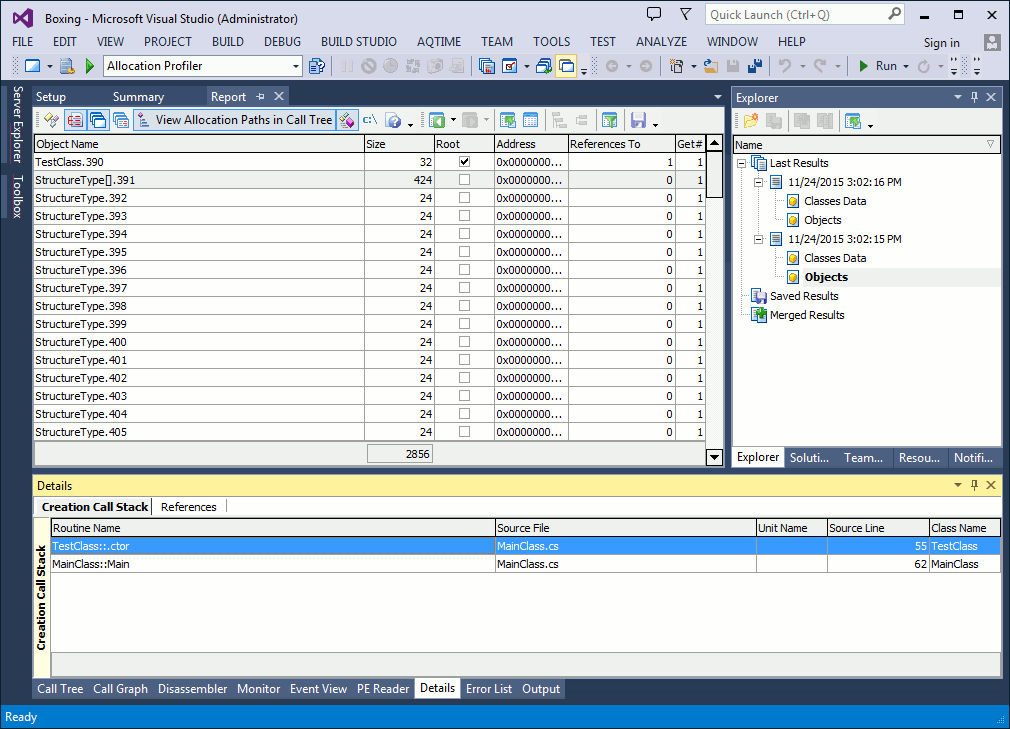
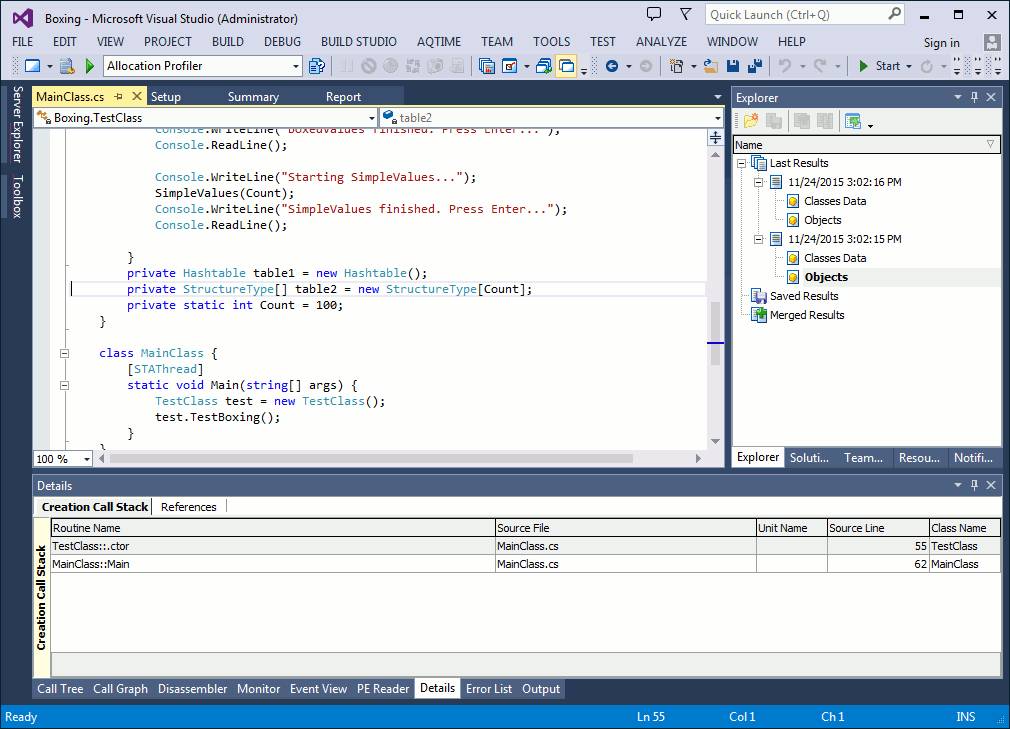
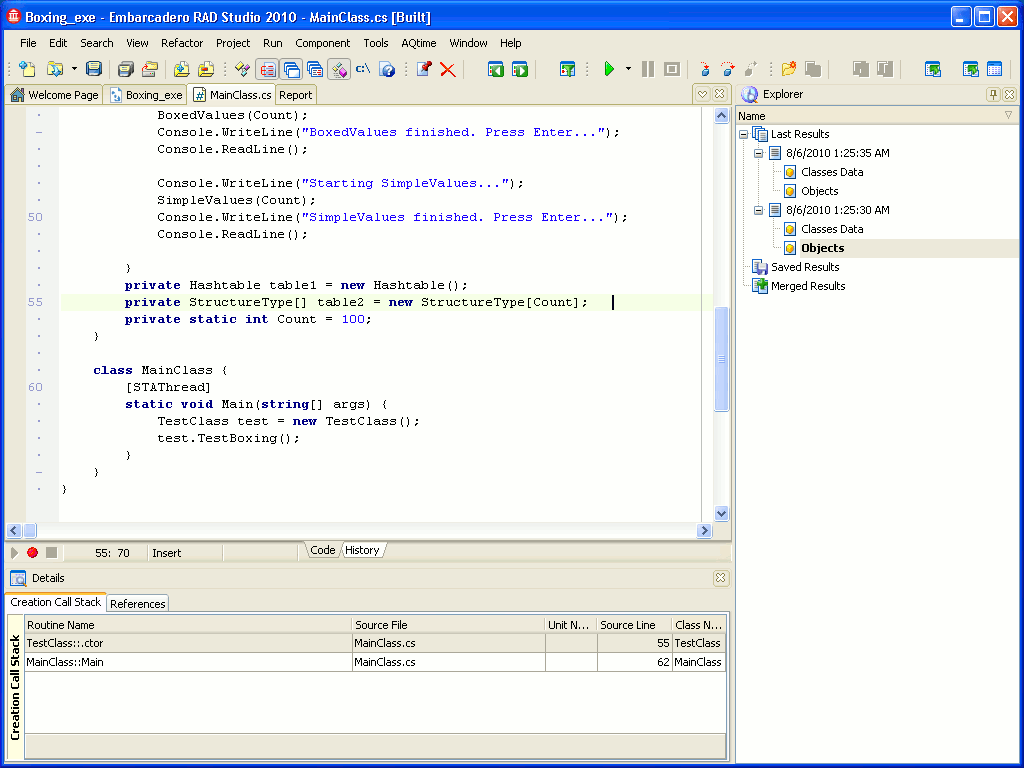
To view how an individual class instance was created, select the corresponding row in the Report panel and switch to the Details panel:
The Creation Call Stack pane of the Details panel displays a stack of function calls that led to the creation of an instance selected in Report. The top function is the very function that created the given object. Double-clicking a function displays its source code (if it is available) in the Editor panel.Double-clicking a function displays the function’s source code in Visual Studio’s Code Editor.Double-clicking a function displays its source code (if it is available) in the Editor of Embarcadero RAD Studio. (The link to source code is only available if your application was compiled with debug information. See How AQTime Profilers Use Metadata and Debug Information. In addition, the path to the source files must be specified in the Project Search Directories or Search Directory dialog.)
| Note: | If the call stack is empty, most likely, you have not added any elements to the Collect Stack Information pane or you have not selected any stack area in this pane. For more information, see Specifying Modules to Be Included Into the Call Stack.
Another possible reason is the absence of debug information for profiled modules that have been added to the Collect Stack Information pane. For more information, see How AQTime Profilers Use Metadata and Debug Information. |


 Prev
Prev