The Resource profiler traces how the profiled application uses Windows resources. Like other AQTime profilers, the Resource profiler generates results upon selecting Run > Get Results from AQTime’s main menuselecting AQTime > Get Results from Visual Studio’s main menuselecting AQTime > Get Results from RAD Studio’s main menu, or after the application terminates.The following sections provide a brief overview of profiler results and panels that hold them:
Viewing Summary Profiling Results
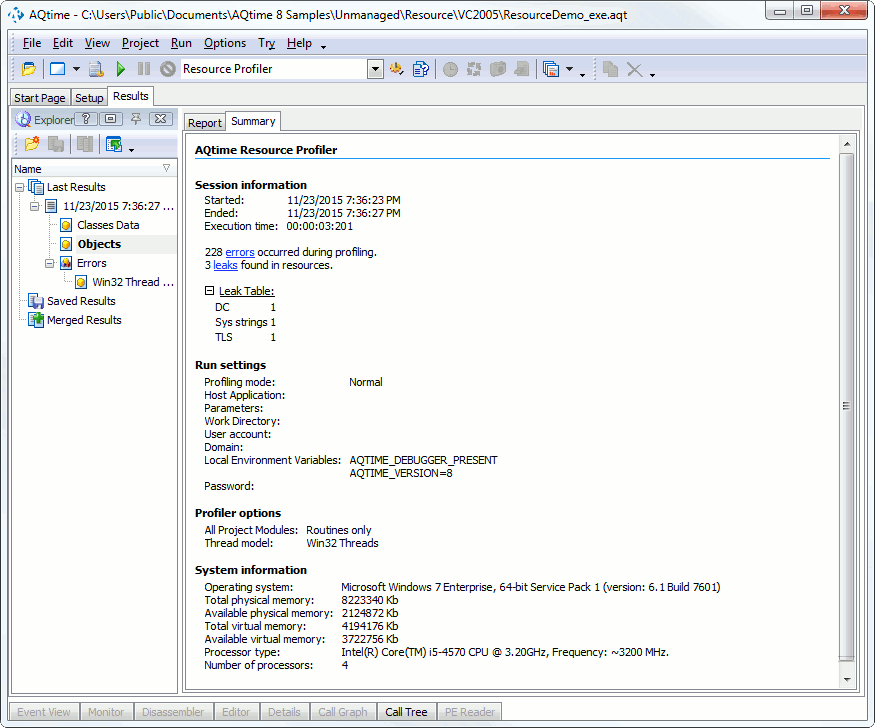
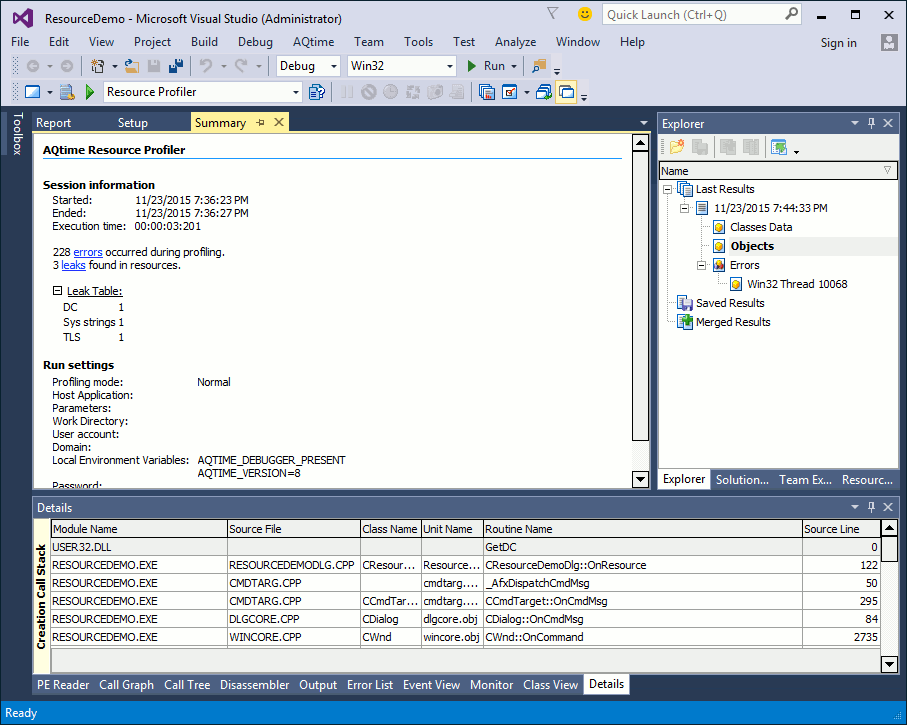
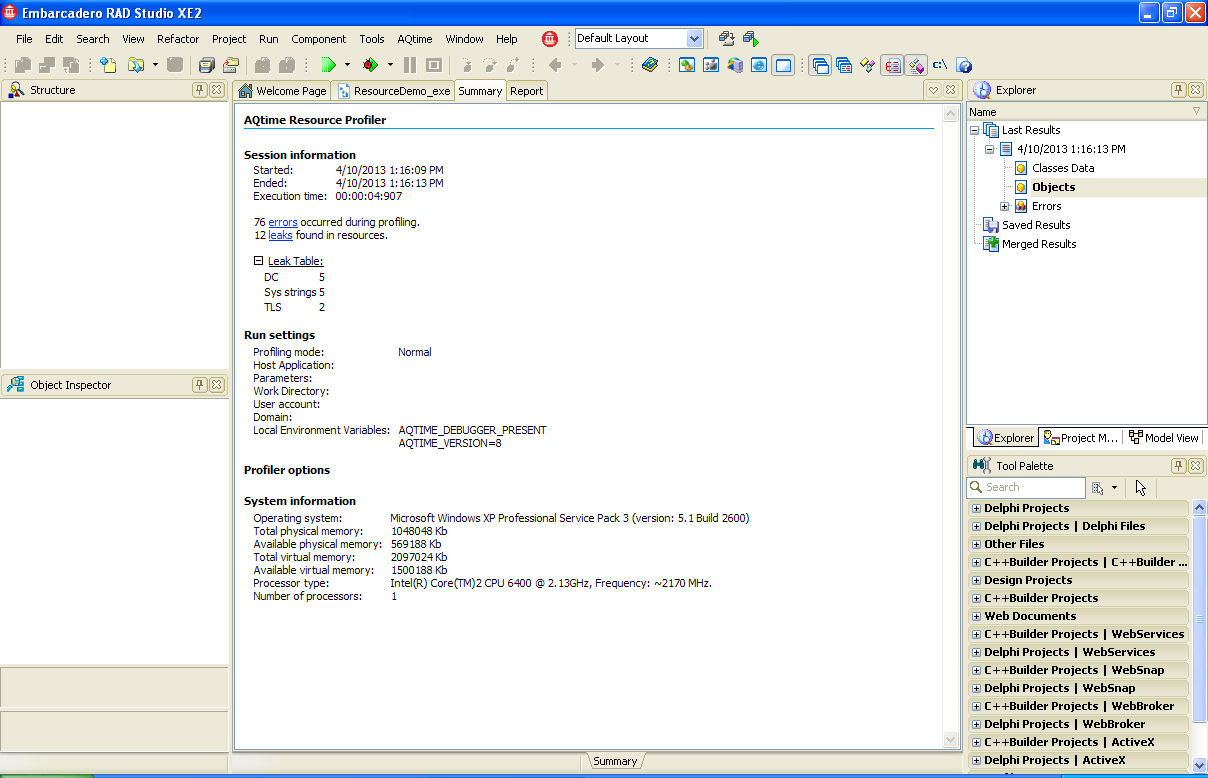
The Summary panel displays brief profiling results. It reports about resources with the maximum number of existing instances, resources with the maximum number of created instances, etc:
Viewing Detailed Information
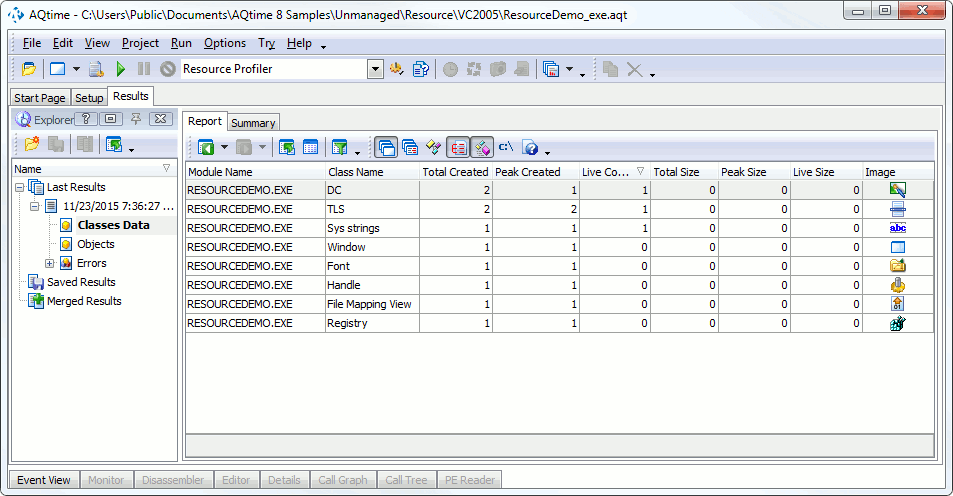
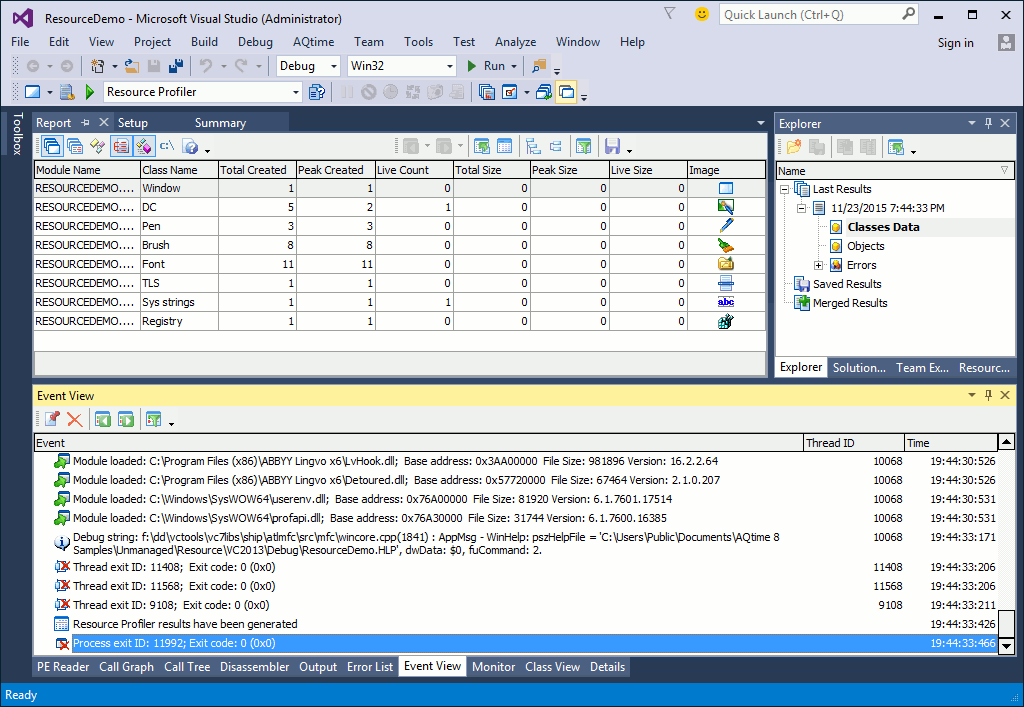
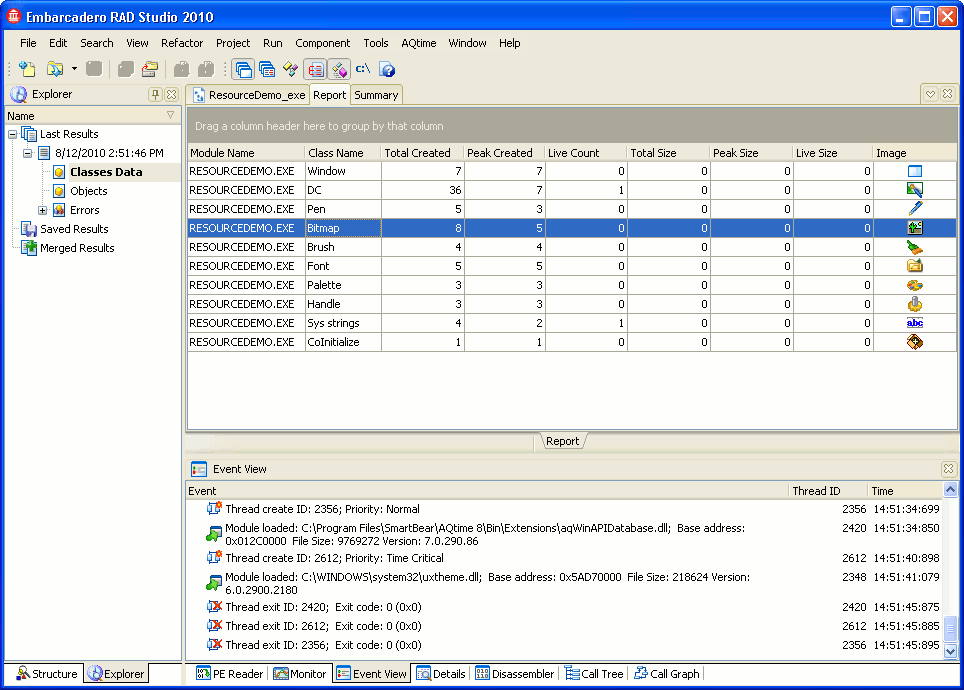
Information about all the resources that are used by the application is shown in the Report panel. Below is a sample output of the Resource profiler:
As you can see, Resource profiler results are divided into three categories: Classes Data, Objects and Errors. These categories are displayed as subnodes of the result set node in the Explorer panel. The contents of the Report panel depend on the currently selected category:
-
Classes Data
If selected, the Report panel shows information about resource types whose instances exist at the moment the results are being generated. For a detailed description, see Results of the Classes Data Category.
-
Objects
If selected, the Report panel displays results for resource instances. For a detailed description, see Results of the Objects Category.
-
Errors
If selected, the Report panel displays results for errors that occurred in API resource-related functions during the run. For a detailed description, see Results of the Errors Category.
When you select an object or a memory block in the Report panel, you can view additional information in the Details panel. For a detailed description of the Resource profiler panels, refer to the Resource Profiler Panels Reference.

 Viewing Summary Profiling Results