The Resource profiler results are divided into three categories: Classes Data, Objects and Errors. When the Objects category is selected, the Report panel displays information about the resource instances that existed in the application at the moment the results were being generated.
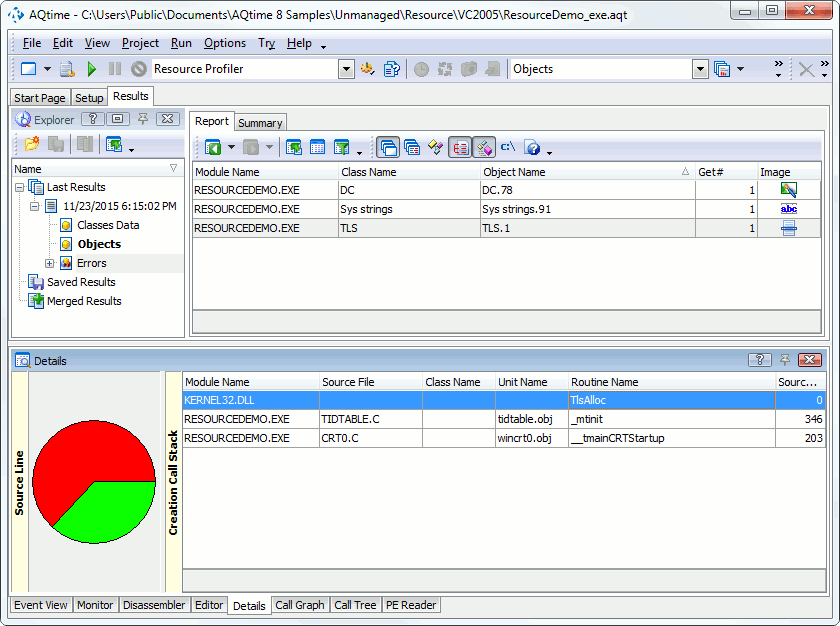
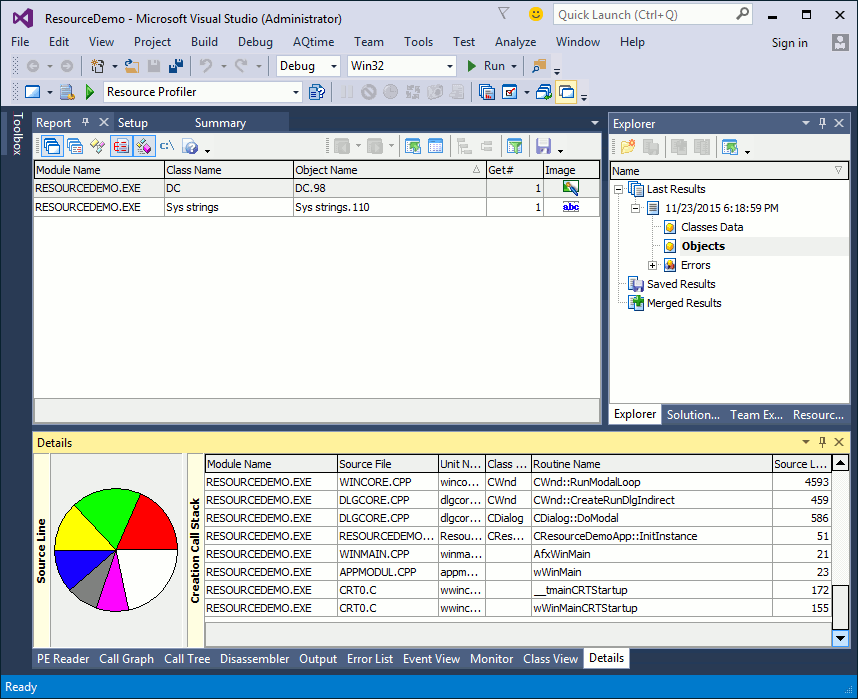
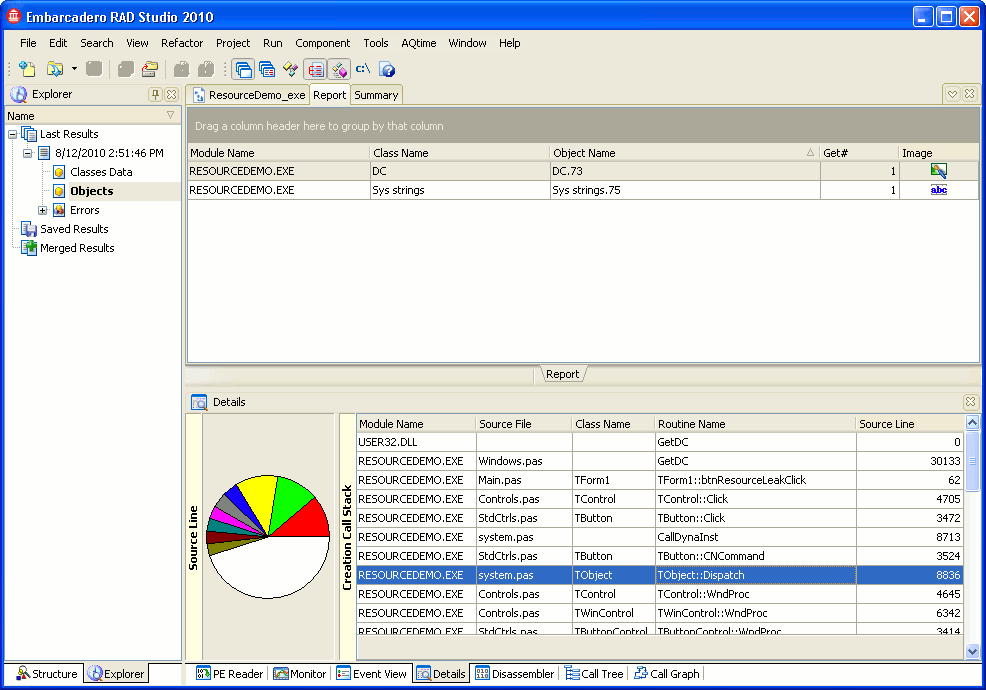
Below is a sample output of Resource profiler results displayed in the Objects category:
The Report panel is the “main” results display for resource instances. The Details and Editor panels display additional results for the resource instance selected in the Report panel.
The following sections describe what information you can get from profiling results:
Viewing Profiling Results
Every row in the panel holds results for a single resource instance. The Object Name column serves as the resource instance identifier. For instance, the name Icon.5 means the fifth resource instance of the Icon type created after profiling started. To view all resource instances of a certain type, filter results on the Class Name column (See Filtering Results).
For a full description of the Report panel's columns, refer to the Report panel description.
Viewing Several Sets of Results
If you pressed  Get Results during the Resource profiler run, you get two result sets: one that was generated upon pressing that button and another one that were generated upon closing the profiled application.
To distinguish the sets of results, take a look at the Get # column. It displays the ordinal number of the result set within a run. In the first result set, in all records, the Get # column will hold 1; in the second result set this column will hold 2, and so on. You can use these values for comparison purposes. For instance, when you compare two result sets, the column will clearly tell you what resource instances were created or deleted between the two moments of results generation.
Viewing Call Stacks in the Details Panel
The Details panel holds one pane: Creation Call Stack. It displays the stack of function calls that led to the resource instance creation. The topmost routine in this stack is the API function that created the resource instance. Columns of the Creation Call Stack page hold information that helps you locate the routine in source code. For more detailed information, review Resource Profiler - Details Panel Columns.
To view the source code of a routine, simply double-click it in the call stack - AQTime will bring up the Editor panel and position the cursor on the first line of the routine’s source code (the source file of the routine must be specified in the Project Search Directories. In addition, to view sources of your managed applications in the Editor, you should compile the application with debug information. See How AQTime Profilers Use Metadata and Debug Information).
The stack is available if any of the stack areas specified in the Collect Stack Information Pane is selected. To disable stack tracing, clear all the check boxes shown in this pane.
| Note: | If the call stack is empty, most likely, you have not added any elements to the Collect Stack Information pane or you have not selected any stack area in this pane. For more information, see Specifying Modules to Be Included Into the Call Stack.
Another possible reason is the absence of debug information for profiled modules that have been added to the Collect Stack Information pane. For more information, see How AQTime Profilers Use Metadata and Debug Information. |
See Also
Resource Profiler
Report Panel
Explorer Panel
Details Panel
Analyzing Profiler Results
Checking for Resource Links
Non-Existent Resources


 Viewing Profiling Results