The Resource profiler results are divided into three categories: Classes Data, Objects and Errors. When the Errors category is selected, the Report panel displays information about errors that occurred in resource-related Windows functions called during the application run. For instance, if the CreateIcon function fails, it will be reported in this panel.
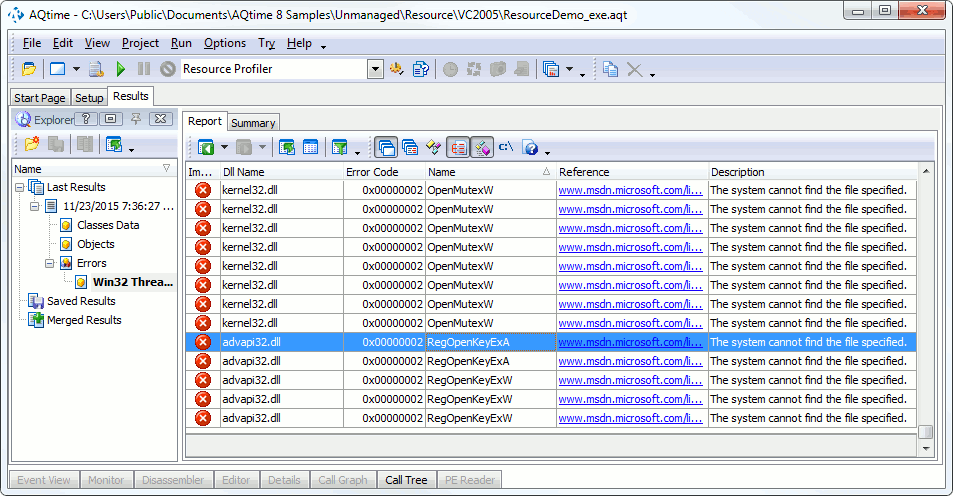
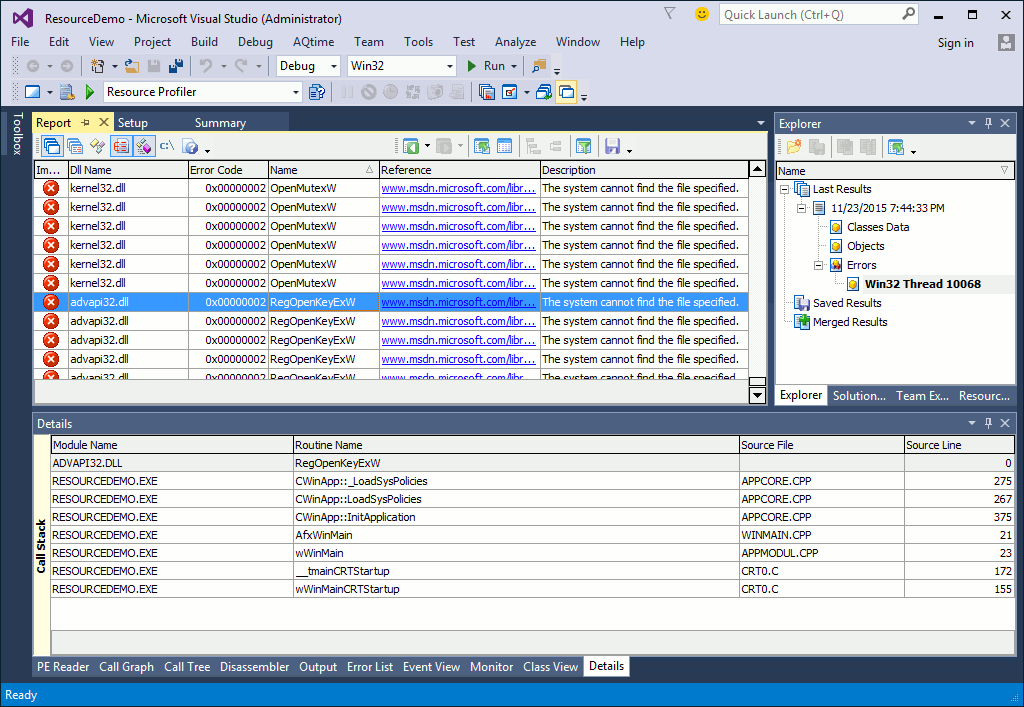
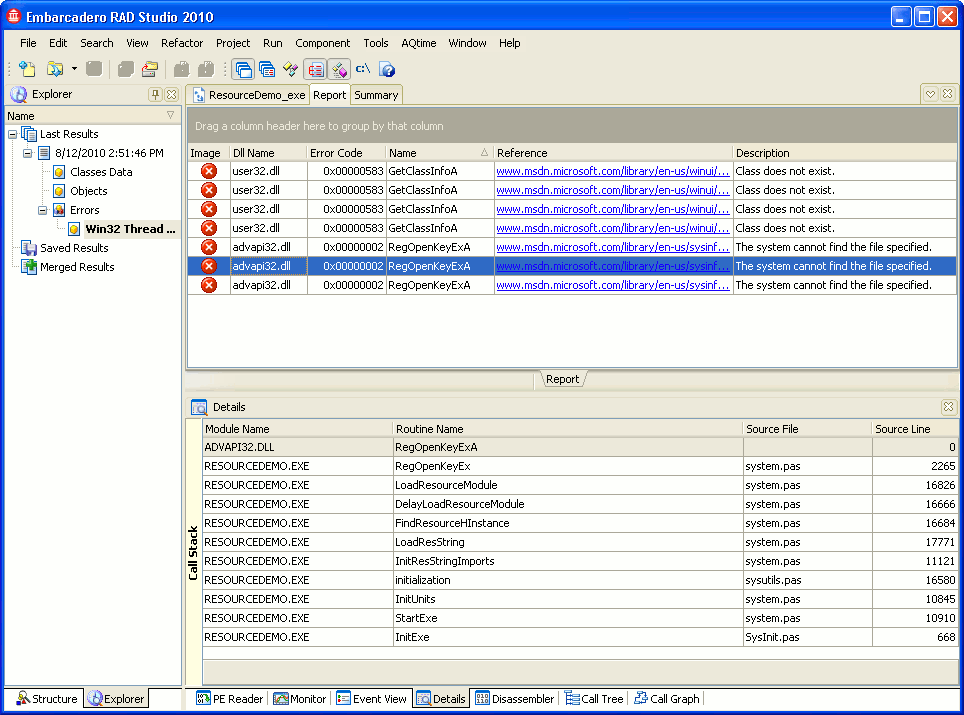
Below is a sample output of Resource profiler results displayed in the Errors category:
The following sections describe what information you can get from profiling results:
Viewing Profiling Results
For each error listed, you can see in which function it occurred, a description of the error and a link to the MSDN topic that holds comprehensive information about the given function. Thus, you can quickly find out what resource-related functions failed (if any) and why this happened. For the full description of available columns, see the Resource profiler panels reference topic.
Note that the Resource profiler divides results by threads under the Errors category. Threads are identified by their IDs. You can select a single thread in the Explorer panel or select All Threads to display all the results. For detailed information on profiling multiple threads, see the topics of the Profiling Multithreaded Applications topic.
Viewing Call Stacks in the Details Panel
Like for the Objects category of profiling results, the Details panel displays call stack information. In this panel, this is the stack of function calls that led to the error selected in the Report panel. If your application was compiled with debug information, you can view the source code of the routine selected in the call stack. For this purpose, just double-click the routine in the call stack.
See Also
Resource Profiler
Report Panel
Explorer Panel
Details Panel
Analyzing Profiler Results
Checking for Resource Links
Non-Existent Resources


 Viewing Profiling Results