The Reference Count profiler tracks the number of references to interface objects. Like other AQTime profilers, Reference Count generates results upon selecting Run > Get Results from AQTime’s main menuselecting AQTime > Get Results from Visual Studio’s main menuselecting AQTime > Get Results from RAD Studio’s main menu, or after the application terminates.The following sections provide a brief overview of profiler results and panels that hold them:
Viewing Summary Profiling Results
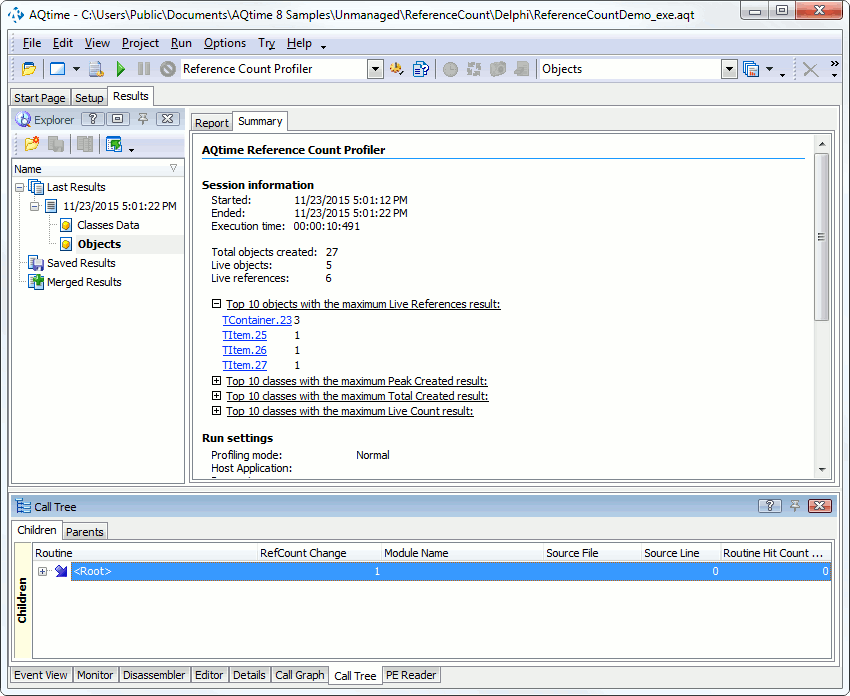
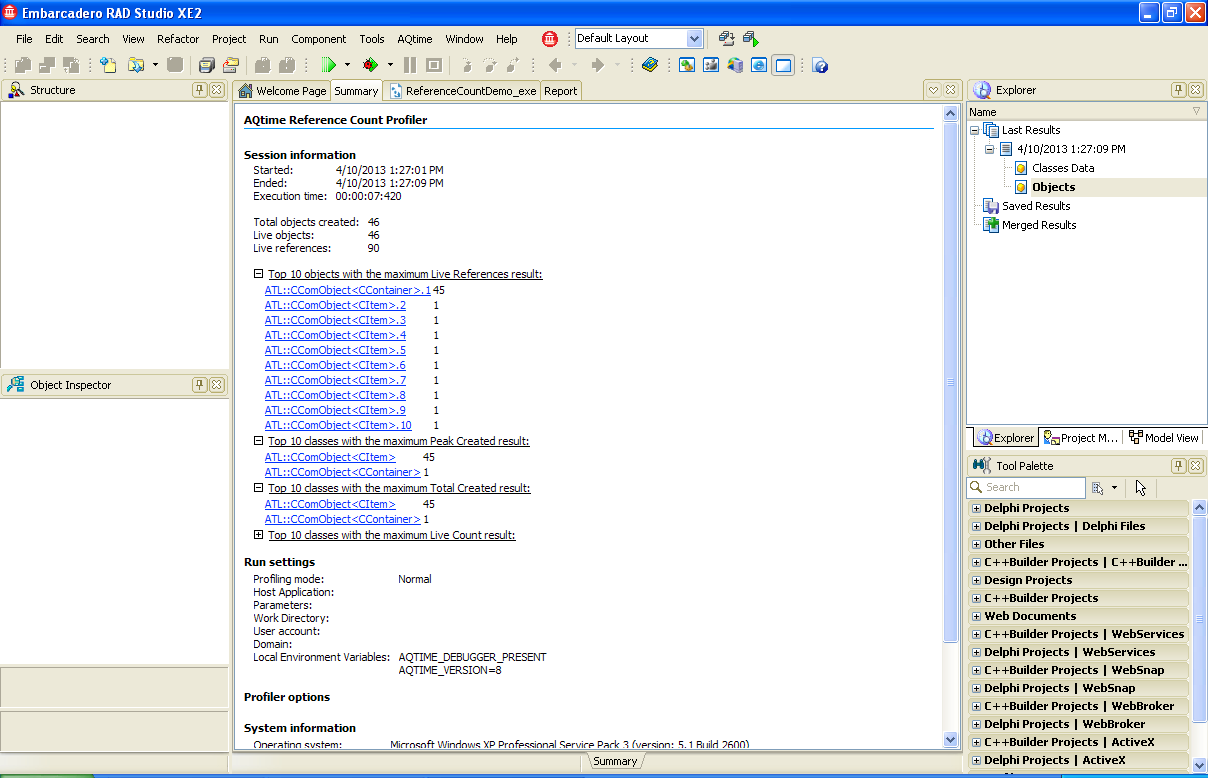
The Summary panel displays brief profiling results. It reports classes with the maximum number of existing instances, classes with the maximum number of created instances and so on:
Viewing Detailed Information
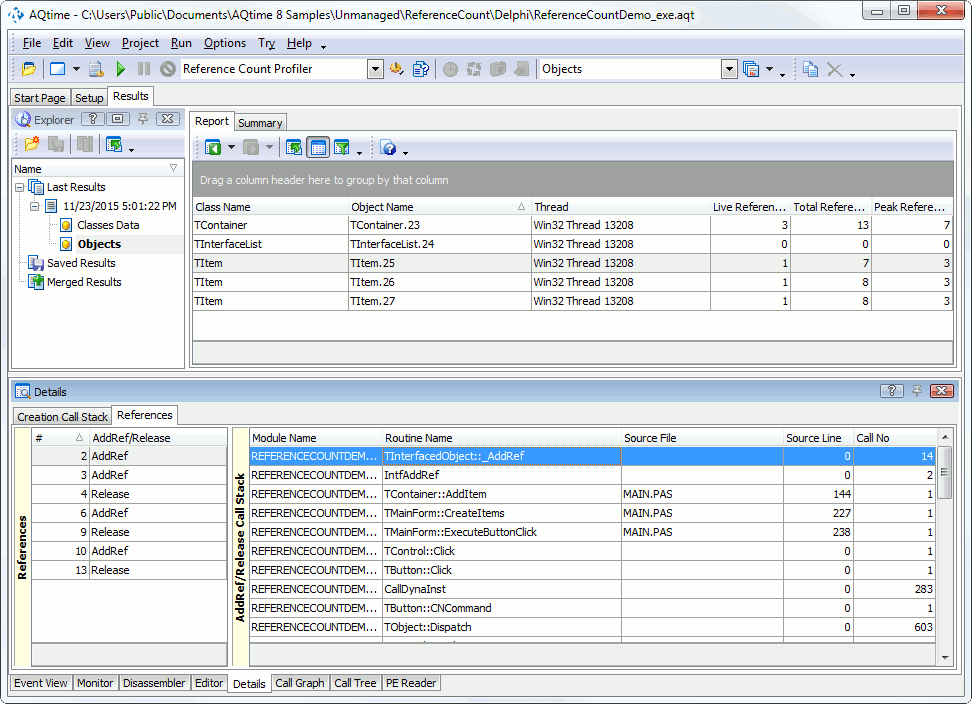
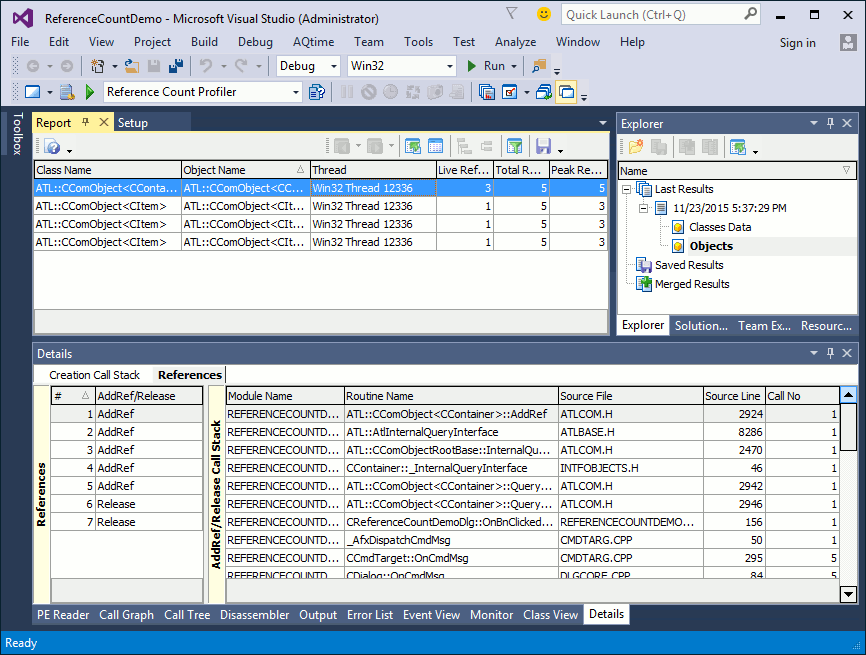
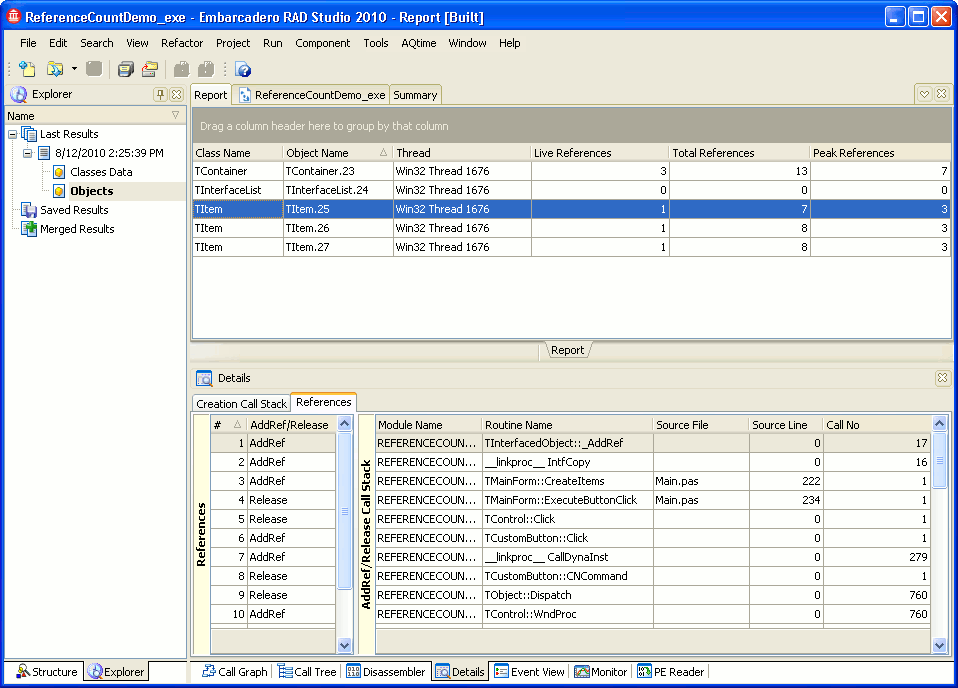
Information about all classes and their instances that are used by the application is shown in the Report panel. Below is a sample output of the Reference Count profiler's results:
As you can see, the Reference Count profiler results are divided into two categories: Classes Data and Objects. These categories are displayed as subnodes of the result set node in the Explorer panel. The contents of the Report panel depend on the currently selected category:
-
Classes Data
If selected, the Report panel provides a general overview of which classes produce interface objects. For a detailed description, see Results of the Classes Data Category.
-
Objects
If selected, the Report panel provides a more detailed report on each interface object that existed at the time when results were generated. For a detailed description, see Results of the Objects Category.
When you select an object instance in the Report panel, you can review additional information in the Details, Call Tree and Call Graph panels. For a detailed description of the Reference Count profiler panels, refer to topics of the Reference Count Profiler Panels Reference.
See Also
Report Panel
Details Panel
Call Graph Panel
Call Tree Panel
Reference Count Profiler

 Viewing Summary Profiling Results