The Reference Count profiler results are divided into two categories: Classes Data and Objects. When the Objects category is selected, the Report panel provides a detailed report on each interface object that existed at the time when results were generated. See Reference Count Profiler Panels Reference for the complete list of displayed columns.
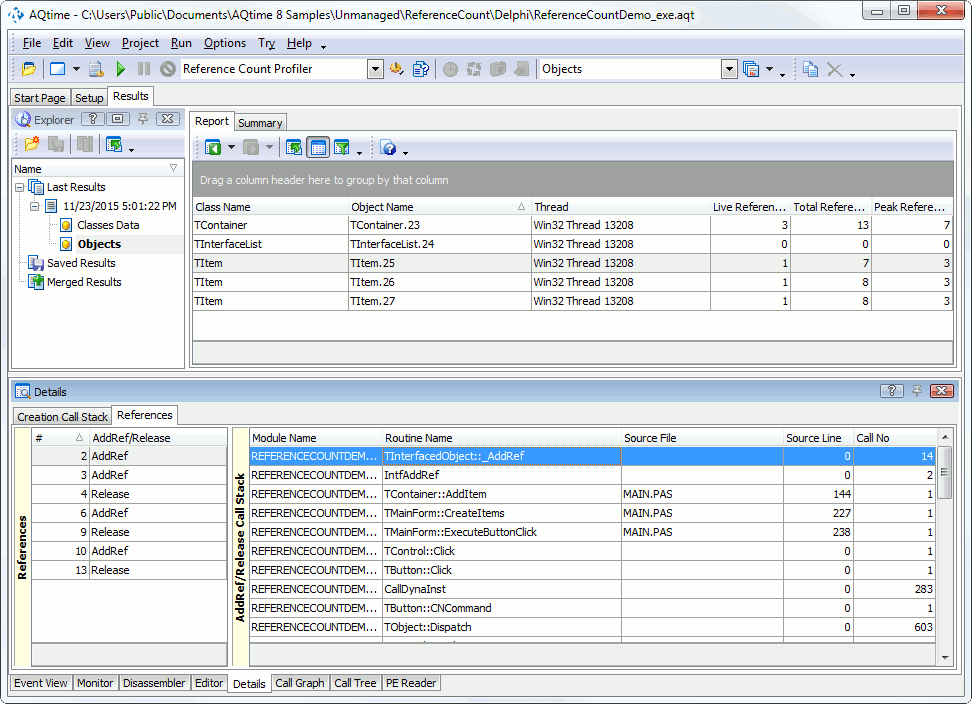
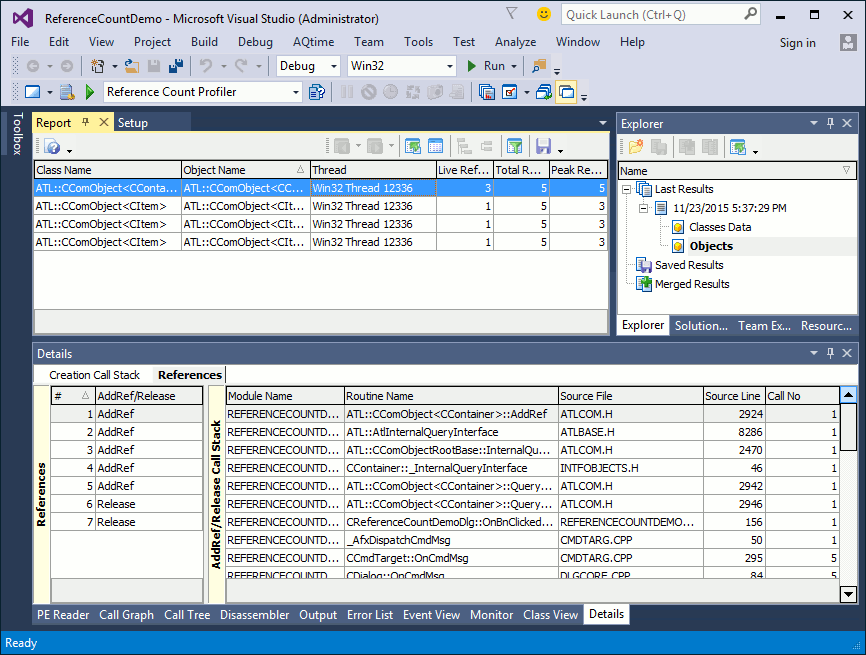
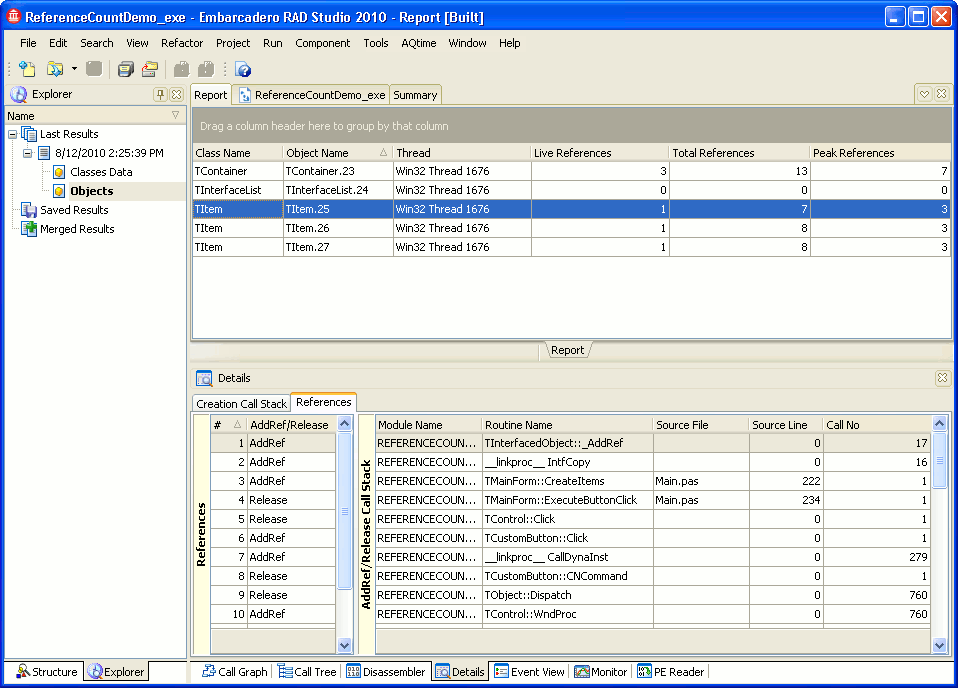
Here is a sample output of the Reference Count profiler results displayed in the Objects category:
Each row in the Report panel corresponds to an unreleased interface object. The object name consists of the class name and the creation number which is relative to other objects of the same class. To find additional information about the selected object, switch to the Details, Call Tree and Call Graph panels:
-
The Details panel includes three panes, Creation Call Stack, References and AddRef / Release Call Stack. The Creation Call Stack pane describes how the chosen object was created. The other two panes report how object references were made and removed. Both of the call stack panes display code instructions, and a double-click on any instruction will take you to the corresponding line in the source code (if it is available to the Editor panel).
-
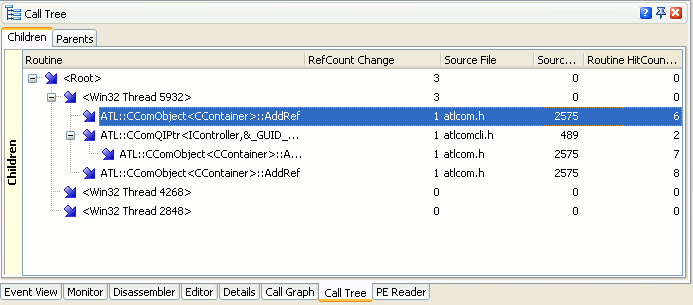
The Call Graph and Call Tree panels show how the reference counter was modified during the application execution, how it was altered by calls to this or that routine. The Call Graph displays this data in the graphical form while the Call Tree uses the table view with expandable rows. For a full description of columns available in the Call Tree panel, see the description of the Call Tree panel.

See Also
Reference Count Profiler
Report Panel
Explorer Panel
Details Panel
Analyzing Profiler Results


