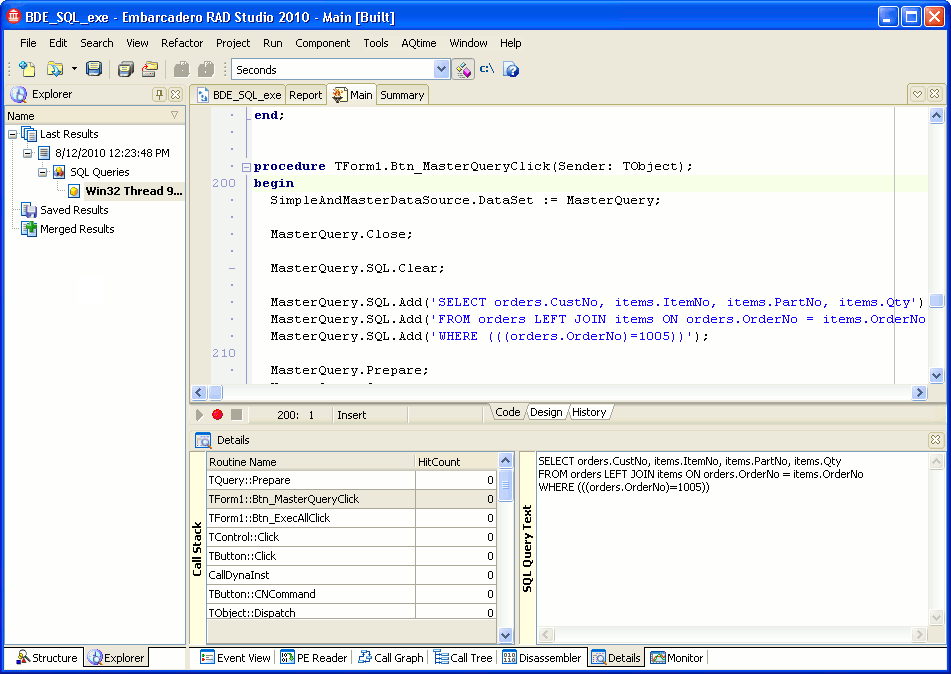
The BDE SQL profiler measures the execution time of SQL queries or SQL stored procedures. Like other AQTime profilers, the BDE SQL profiler generates results upon selecting Run > Get Results from AQTime’s main menu or when the profiled application is terminated.The following sections provide a brief overview of profiler results and panels that hold them:
Viewing Summary Profiling Results
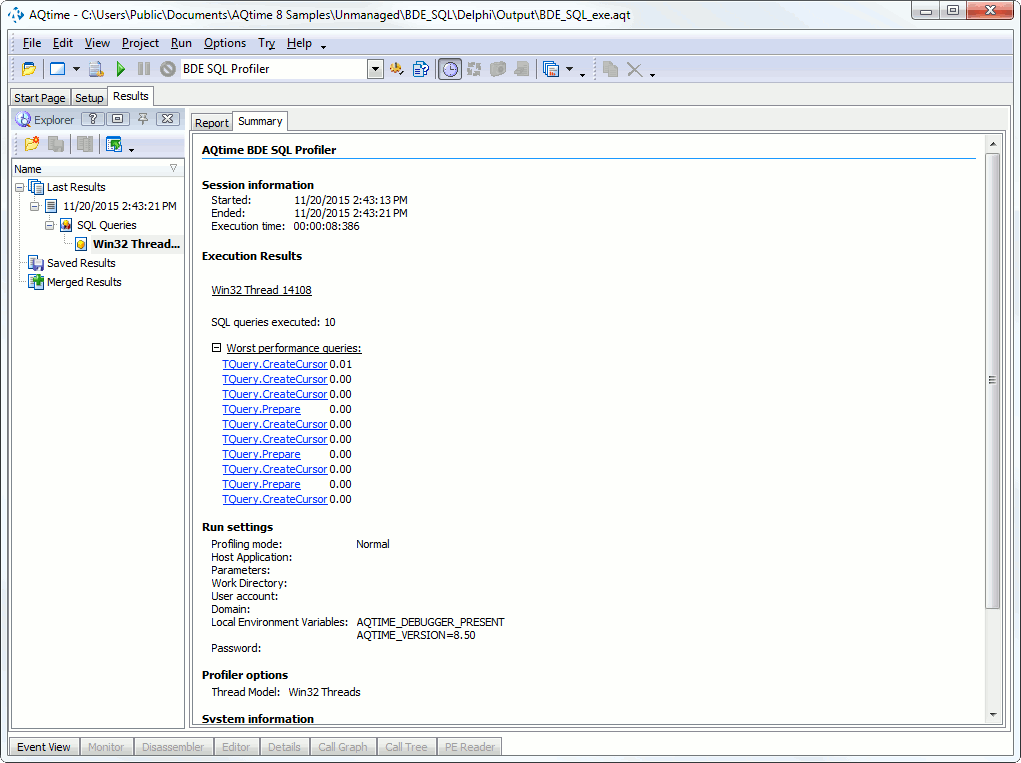
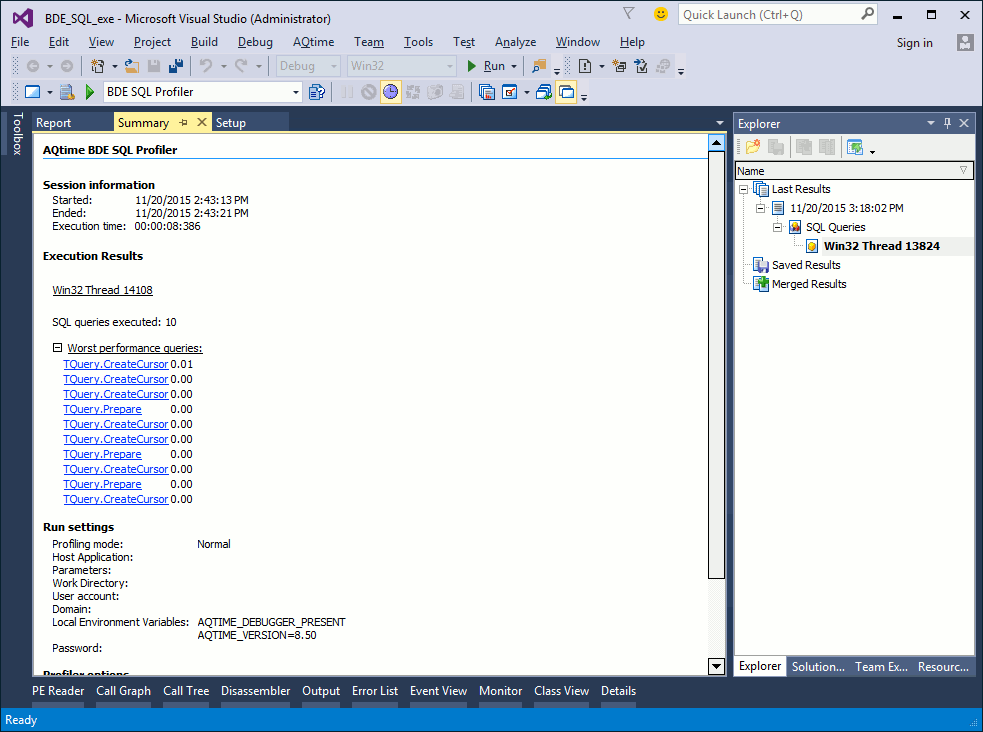
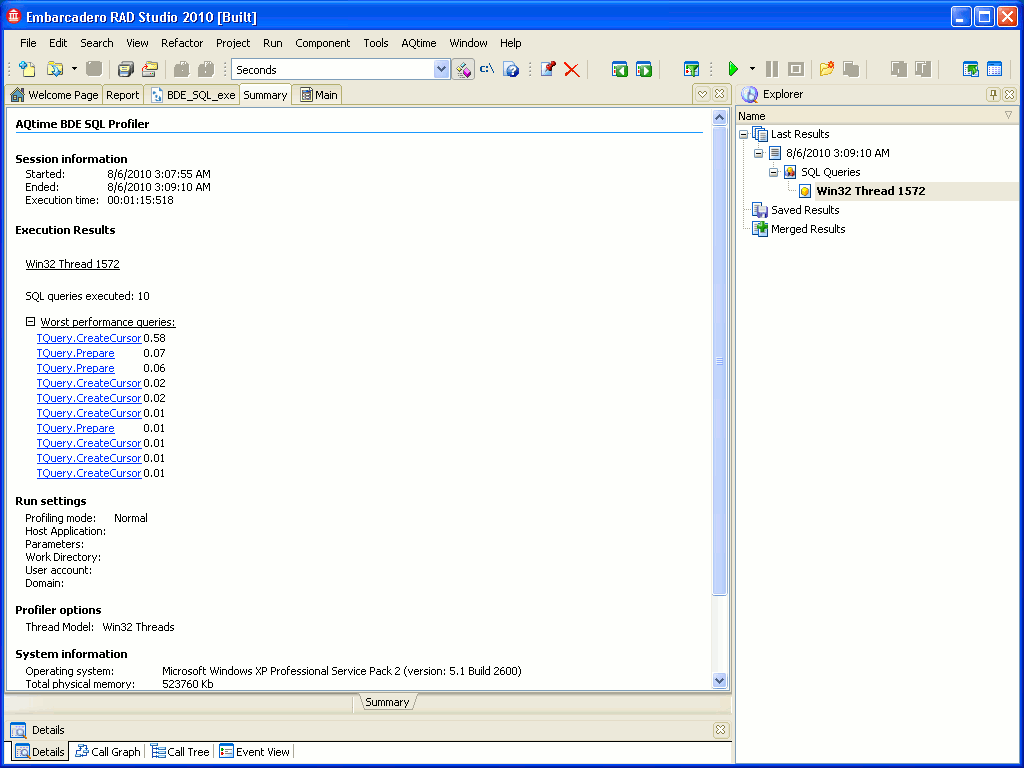
The Summary panel displays brief profiling results: the total number of executed SQL queries and the worst performing queries.
Viewing Profiling Results
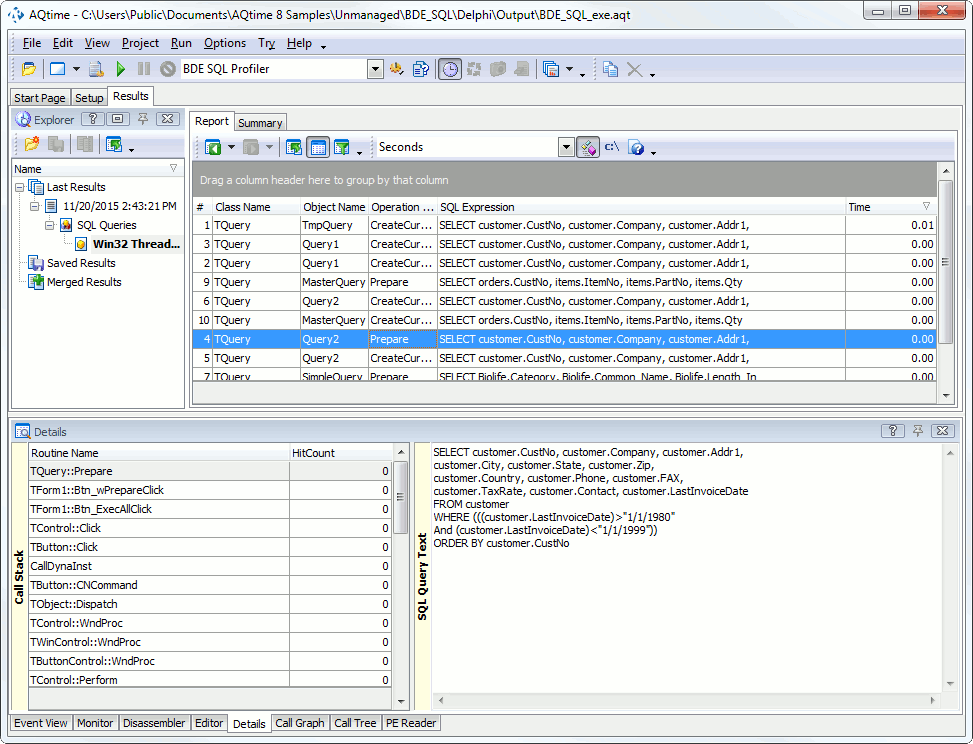
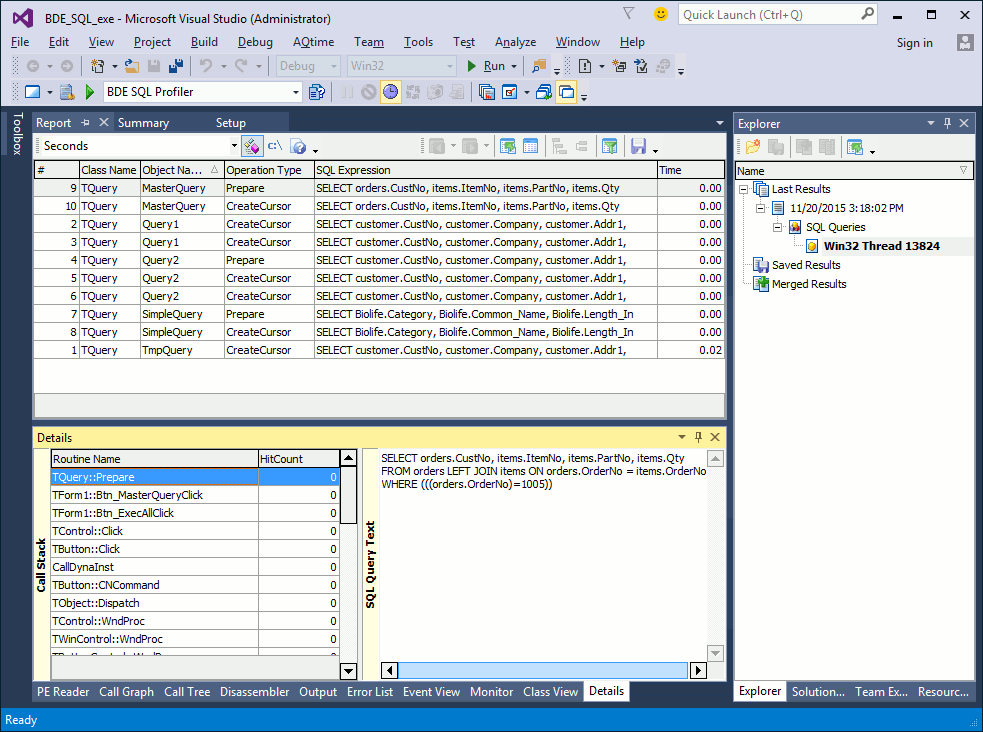
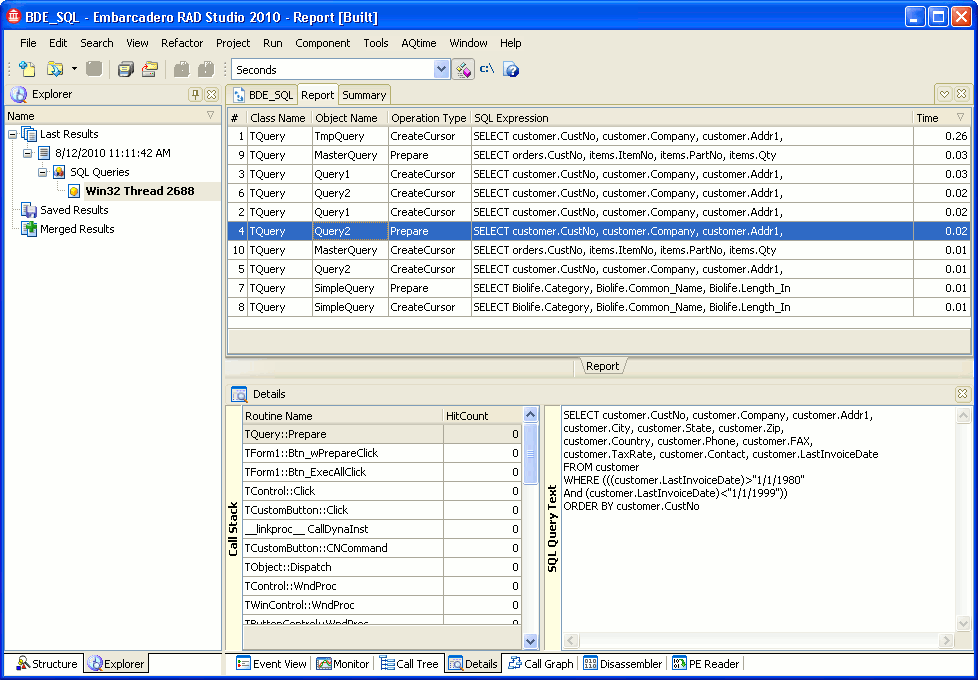
Detailed information on individual SQL queries is displayed in the Report and Details panels. Each row of the Report panel contains results of the ExecSQL, ExecProc or Prepare method execution. Here is an example of the BDE SQL profiler output:
The columns of the panel indicate the class name and the name of the query or stored procedure, an SQL expression and other information. To obtain the execution time of a query or stored procedure, view the Time column. For complete information on columns of the Report panel, see BDE SQL Profiler - Report Panel.
Note that by default, the BDE SQL profiler shows all available columns of the Report panel. You can remove, add and arrange columns in the panel. For more information, see the Adding and Removing Columns and Arranging Columns, Lines and Panels topics.
Viewing Additional Information
Each row in the Report panel corresponds to a single SQL query in your application. Clicking on a query in the Report panel will update the contents of the Details panel, so it will display information concerning that query.
The Details panel contains the following panes:
-
The Call Stack pane that displays the sequence of functions that call the BDE operation currently selected in the Report panel.
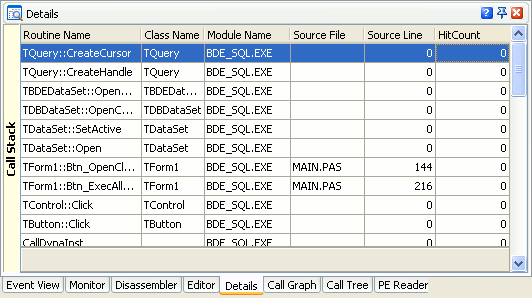
-
The SQL Query Text pane of the panel shows the complete code of the SQL query selected in the Report panel (in addition to the SQL Expression column of the Report panel).
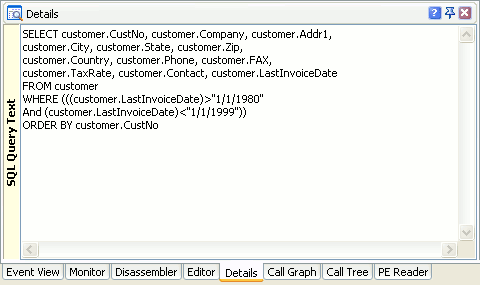
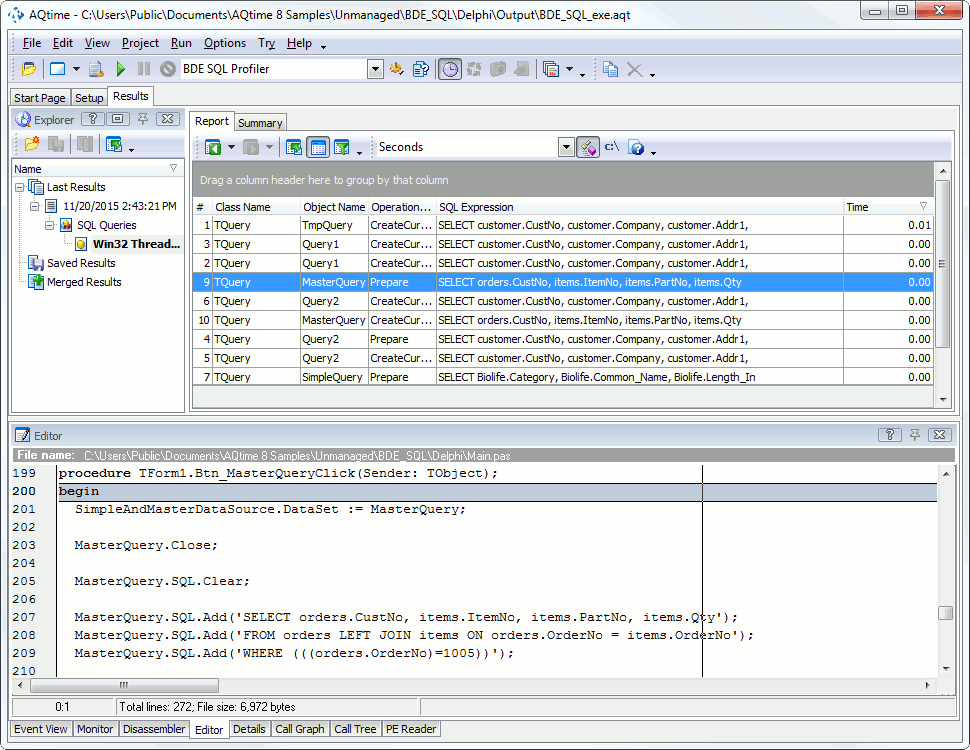
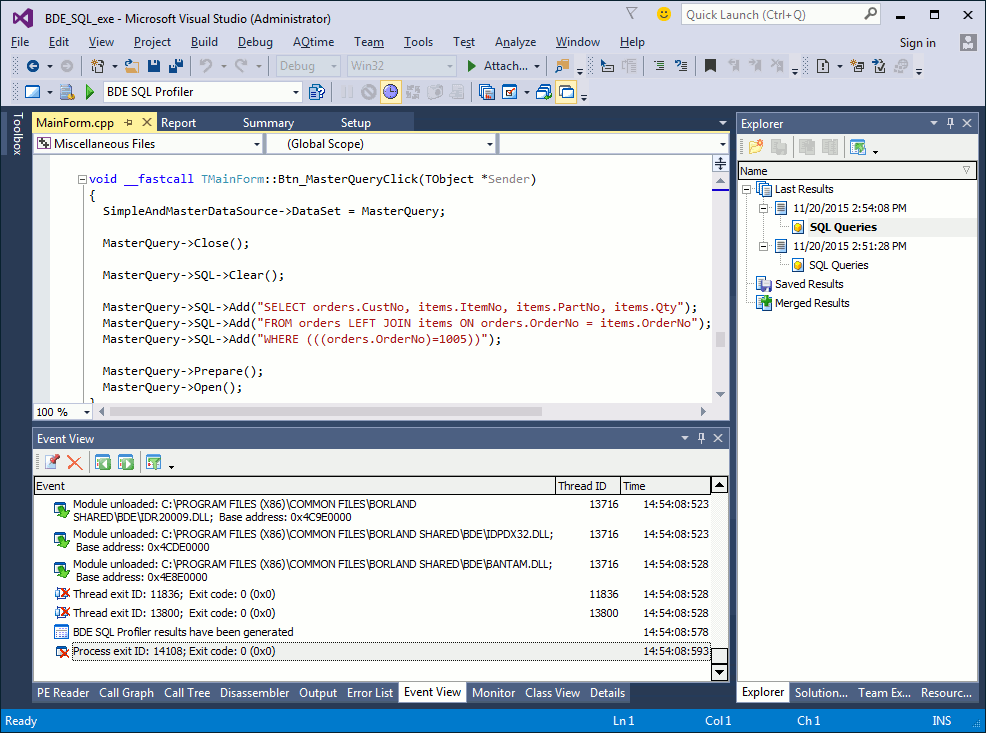
Double-clicking a row in the Details table will move the cursor in the Editor panel to the source code line for the compliance routine (the path to the source files must be specified in the Project Search Directories and Search Directory dialogs).Double-clicking a row in the Details table will move the cursor in the page that contains the source code to the source code line for the compliance routine.Double-clicking a row in the Details table will move the cursor on the page that contains the source code to the source code line for the compliance routine.
See Also
BDE SQL Profiler Results
BDE SQL Profiler
BDE SQL Profiler - Overview
BDE SQL Profiler - Report Panel
BDE SQL Profiler - Details Panel
Comparing Results
Merging Results

 Viewing Summary Profiling Results