The following sections provide information on how to check whether an application writes to addresses that are out of memory bounds:
About the Check Memory Bounds Option
The Allocation Profiler includes an option, Check memory bounds, which specifies whether the profiler reports an error when the profiled application writes to addresses above the upper or below the lower bound of an allocated memory block.
 |
The Check memory bounds feature only operates with native-code (unmanaged) applications. It does not work with managed code applications. |
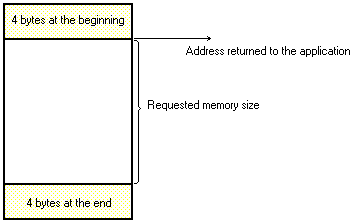
To perform a memory check, the profiler hooks functions that allocate memory blocks. It returns a block allocated for 8 bytes more than requested, but the application is only informed of owning the size it requested. 4 bytes are reserved before the requested block, and 4 are reserved after --

The profiler leaves its own signatures in each 4-byte buffer. If the application overwrites the memory outside of these 4-byte buffers, AQTime will not report an error.
 |
Note that AQTime does not track allocations done on the stack, therefore you cannot track violations in the stack memory blocks. |
Detecting Memory Violations
AQTime determines that the bounds were exceeded when it finds a 4-byte signature that was overwritten. Note that the profiler detects the memory corruption in one of the following situations:
-
A memory block is released.
-
A memory block is reallocated.
-
The application is terminated (note that the memory manager must reside in the main application's executable, otherwise, the profiler will be unable to detect memory corruption).
-
The Get Results command is executed (see below).
The call stack corresponds to the situation and if it is impossible to trace the call stack, it will be empty:
-
If the profiler detects a memory corruption when a block is deleted of reallocated, the call stack will display the sequence of function calls that led to the block deletion or reallocation. The call stack will not point to the routine that includes the code statements that violated memory block bounds.
-
If a corrupted block is detected when the application terminates, the profiler is unable to trace the call stack so the call stack appears empty.
-
The same happens if the memory corruption is detected when the Get Results command is working since in this case there is no routine for which the call stack information can be gathered.
The Allocation profiler displays the bounds check results along with information about existing classes and instances. The Classes Data category of the Report panel contains the Memory Overwrite Error row. The presence of this row indicates that the profiler detected a violation of memory block bounds. The Objects category contains a row for every memory violation, which the profiler detected. The row contains the text Memory Overwrite Error.nn (where nn specifies the number of the detected violations).
To detect a corrupted block, you can view the stack of function calls that led to the error detection. For more information on how to do this, see Viewing Call Stacks.
Important Notes
-
Memory overwrites cause application crashes. The purpose of the Allocation profiler is to detect the overwrites and report about them. However, if the application overwrites more than 4 bytes, the application can crash even when it is running under AQTime.
-
The application may be coded on assumptions concerning memory, which should not be made, but “generally work”. Therefore it may work well outside of AQTime and misbehave under AQTime with the Check memory bounds option enabled. For instance, it might allocate two consecutive blocks of memory, then attempt to fill them in one call to ZeroMemory():

This ruins the memory-bounds checking, but it also constitutes unexpected conditions for the application itself. In general, applications should not be coded on the assumption that they control the order of allocations from the memory manager. The workaround is to disable Check memory bounds. If the problem goes away, then this was probably the cause.
-
Due to certain peculiarities of AQTime, the Clear Results command does not work if the Check memory bounds setting is enabled.
-
Since the bounds-checking control causes additional memory spaces to be allocated, some tools that trace the memory usage (for example, Task Manager) will slightly exaggerate the memory used by your application.
See Also
Find Memory Block Violations
Allocation Profiler
Allocation Profiler Panels Reference
Viewing Call Stacks
Allocation Profiler Options

 About the Check Memory Bounds Option