
This topic describes how to profile ASP.NET applications or services using the Internet Information Services (IIS). Any ASP.NET application that is created with any development tool can be profiled with the help of the IIS. Applications created in Microsoft Visual Studio 2005, Microsoft Visual Studio 2008, Visual Studio 2010 or Visual Studio 2012 can also be profiled with the ASP.NET Development Server, but there are some difficulties with profiling 64-bit applications. See Profiling ASP.NET Applications via ASP.NET Development Server for details.
 2. Preparing Application for Profiling
3.1. Adding Application to IIS 4 - 6
3.2. Adding Application to IIS 7 - 7.5
4. Preparing AQTime Projects When Profiling 64-bit ASP.NET Applications
Sample Application
In our explanation we will use a sample application called XMLTrace. It parses an XML file and displays its contents and structure. You can find the application’s sources in the following folders:
Microsoft Visual Studio 2013 projects:
<AQTime Samples>\Managed\VS2013\ASP.NET\XMLTrace\CS\ Microsoft Visual C# .NET version
<AQTime Samples>\Managed\VS2013\ASP.NET\XMLTrace\VB\ Microsoft Visual Basic .NET version
 |
On Windows Vista and later, AQTime samples are located in the <Users>\Public\Documents\AQTime 8 Samples folder. On other operating systems, the samples reside in the <Documents and Settings>\All Users\Documents\AQTime 8 Samples folder. |
We will use the Visual Basic .NET sample located in the <AQTime Samples>\Managed\VS2013\XMTrace\VB folder. To run this sample application, you will need Microsoft Internet Explorer 7.0 or later.
Requirements
Profiling ASP.NET applications requires 32- or 64-bit editions of Windows XP, Windows Server 2003 or later with Internet Information Services ver. 4.0 - 7.5.
If you are going to profile a 32-bit ASP.NET module on a 64-bit operating system, you should enable support for 32-bit applications in the IIS and ASP.NET settings. For more information on this, see below.
1. Configuring IIS
In further explanations, we will assume that ASP.NET and IIS are running in the default configuration. If ASP.NET or IIS is running under a user account, you should specify certain permissions for this account. Follow the link for more information about this.
For 64-bit versions of IIS: Under 64-bit versions of Windows, the ASP.NET process can operate in 64-bit mode (default) or in 32-bit mode. On 64-bit operating systems, 64-bit processes cannot load 32-bit DLLs and 32-bit processes cannot load 64-bit libraries. So, if your IIS application is a 32-bit application and you are going to run it on a 64-bit version of IIS, then you must configure IIS in order for it to be able to run your application.
To switch ASP.NET and IIS to the 32-bit mode:
-
Open the command-line window, type the following command and press Enter:
cscript %SystemDrive%\inetpub\AdminScripts\adsutil.vbs SET W3SVC/AppPools/Enable32BitAppOnWin64 1
-
Go to the <Windows>\Microsoft.NET\Framework\<Framework_Version> folder. Here, Framework_Version is a placeholder for the folder, whose name corresponds to the .NET Framework version installed on your computer. For instance, it can be
v1.1.4322,v2.0.50727and so on. -
Run the aspnet_regiis.exe executable that resides in this folder with the
-iargument in the command line:aspnet_regiis.exe -i
To switch ASP.NET and IIS back to the 64-bit mode:
-
Open the command-line window, type the following command and press Enter:
cscript %SystemDrive%\inetpub\AdminScripts\adsutil.vbs SET W3SVC/AppPools/Enable32BitAppOnWin64 0
-
Go to the <Windows>\Microsoft.NET\Framework64\<Framework_Version> folder (note the 64 postfix in the folder name) and run the aspnet_regiis.exe executable that resides in this folder:
aspnet_regiis.exe -i
2. Preparing Application for Profiling
Open the sample project <AQTime Samples>\Managed\VS2013\ASP.NET\XMLTrace\VB\XMLTrace.sln in Visual Studio and compile it there. See How AQTime Profilers Use Metadata and Debug Information to decide whether to include debug information. To learn how to compile ASP.NET applications with debug information, see Compiler Settings for ASP.NET.
For Visual Studio 2005 and later users: When you compile an ASP.NET application created as an ASP.NET Web Site project (note that the XMLTrace sample is exactly an ASP.NET Web Site project), Visual Studio organizes the application code into several temporary dynamic link libraries whose location and names are changed from one compilation to another. Since ASP.NET Web Site projects are dynamically compiled by ASP.NET on the web server when users request the application’s web pages, Visual Studio does not create output assemblies with the application code in the project’s folder when compiling the application. The assemblies are temporary, and Visual Studio usually puts them and debug information files (if you compile the application with debug information) to temporary subfolders of the <Windows>\Microsoft.NET\Framework\<Framework Version>\Temporary ASP.NET Files folder. Since the names are changed, you have to include new modules in your AQTime project every time you compile your application, and there is no guarantee that you will add all application modules, since their names and locations are defined by Visual Studio.
To avoid these problems, you can publish your ASP.NET Web Site project before profiling it (you should publish your ASP.NET application every time you compile it). The folder that you will specify for publishing will contain all DLLs generated for your ASP.NET application. It is recommended that you publish your project in the folder that is used as a virtual directory. If you publish it to another folder, you should specify that folder as a source folder for your virtual directory.
For Visual Studio .NET 7.x users: The XMLTrace application compiled with Visual Studio .NET 7.x requires that the System.Web.dll library be in the application’s folder. Copy this library from your .NET Framework folder (for example, <Windows>\Microsoft.NET\Framework\<Framework_Version>) to the <AQTime Samples>\Managed\ASP.NET\XMLTrace\VB\bin folder.
3. Adding Application to IIS
Next, we need to create an IIS application corresponding to our sample ASP.NET application. The way you do this depends on the IIS version.
3.1. Adding Application to IIS 4 - 6
-
Open the Control Panel > Administrative Tools > Internet Information Services window (it is displayed in Microsoft Management Console).
-
Right-click the Default Web Site node and select New > Virtual Directory from the context menu.
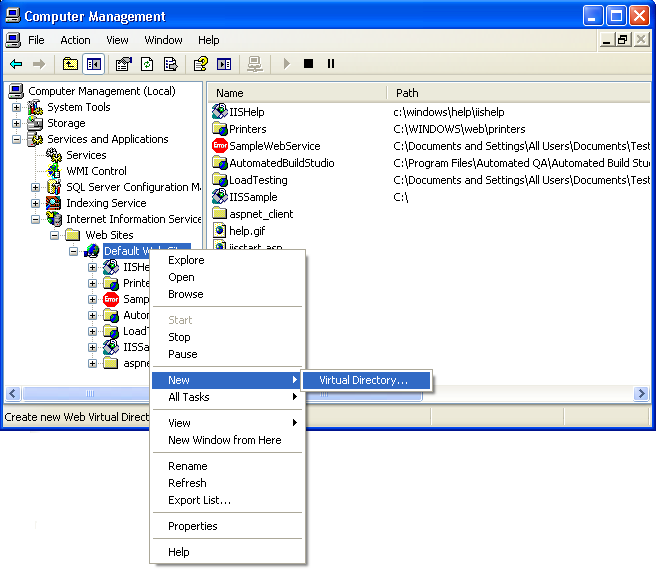
Follow the instructions of the ensuing wizard to create a new virtual directory. Specify XMLTrace as the virtual directory alias and map this virtual directory to the folder, where the compiled DLLs reside.
-
In the Internet Information Services Manager, right-click the XMLTrace\VB node and select Properties from the context menu.
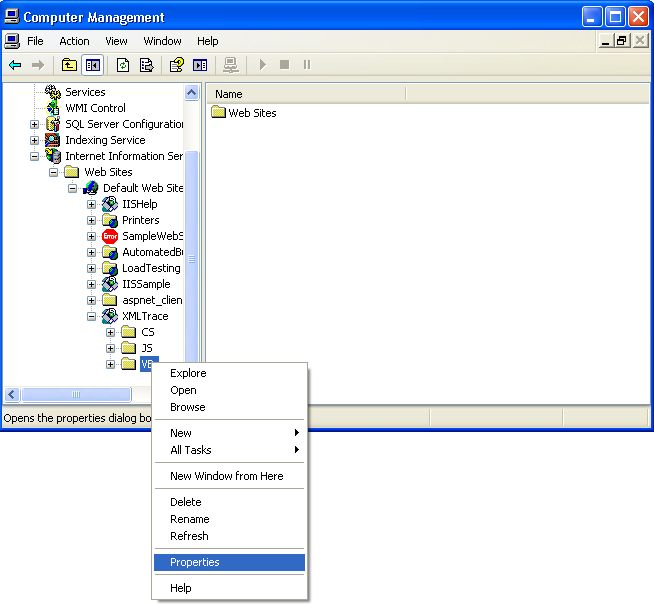
This will call the dialog where you can create and modify properties of our IIS application.
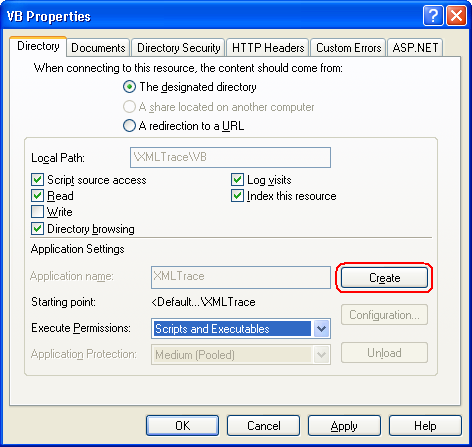
-
In the dialog, press Create. This will create a new IIS application. Then press OK to close the dialog.
3.2. Adding Application to IIS 7 - 7.5
-
Open the Control Panel > Administrative Tools > Internet Information Services (IIS) Manager window.
-
Right-click the Default Web Site node and select Add Application from the context menu.
Use the ensuing Add Application dialog to create a new IIS application. Specify XMLTrace as the application alias and map it to the folder where the compiled DLLs reside.
4. Preparing AQTime Projects When Profiling 64-bit ASP.NET Applications
AQTime can profile both 32- and 64-bit ASP.NET applications. These applications are opened either with a 32- or a 64-bit IIS process. When you start profiling in ASP.NET mode, AQTime attempts to detect the “bitness” of this process automatically. To do this, AQTime finds virtual folders that contain modules added to the Setup panel and then detects the “bitness” of IIS application pools in which these modules are used.
However, this approach does not work if you are profiling a module that does not belong to any virtual folder:
If your project contains only those modules that do not belong to a virtual folder, AQTime is unable to detect the “bitness” automatically and always works with a 32-bit IIS process. To work around this problem, include a DLL, which is located in a virtual folder, in your AQTime project. This will help AQTime determine the “bitness” of the IIS process. There is no need to include it in profiling tasks if you do not need this. The only purpose of this DLL is to help AQTime.
5. Running a Profiler
Now we can profile our ASP.NET application with AQTime:
-
Load your application’s module in AQTime. The xmltrace.dll file is in the XMLTrace\VB\bin folder, if you compiled the application in Visual Studio .NET. If you have compiled the sample in Visual Studio 2005 - 2017, the module name and location will differ: the name will include the source file name and a hash value, for instance, it can be App_Web_xmltrace.aspx.cdcad7d2.dll, and the module will reside in a temporary subfolder of the <Windows>\Microsoft.NET\Framework\<Framework Version>\Temporary ASP.NET Files folder. Besides that, if you publish the sample in Visual Studio 2005 - 2017, you can find application modules in the folder you publish the project to.
-
Select
 ASP.NET from the Profiling Mode drop-down list box on AQTime’s Standard toolbar:
-
Select
ASP.NET from the Profiling Mode drop-down list box on Visual Studio’s AQTime toolbar. -
Click the
ASP.NET button on RAD Studio’s AQTime Profiling Modes toolbar. -
Select the desired profiler and press
 Run to start profiling.Select the desired profiler in the AQTime > Profiler menu item or from the Profilers box on AQTime's toolbar. Then choose AQTime > Run (or select Debug > Run while one of AQTime panels is active) to start profiling.Select the desired profiler in the AQTime > Current Profiler menu item. Then choose AQTime > Run With Profiling to start profiling. AQTime may ask your permission to restart the IIS Admin service. Answer “Yes” to this question.
 -
Open the http://localhost/XMLTrace/VB/xmltrace.aspx file in Internet Explorer and perform profiling as your needs dictate.
To avoid launching Internet Explorer manually, you can specify the desired Web page in the Start Page box of the Run Parameters Dialog (for ASP.NET Mode). In this case, AQTime will automatically open this page in Internet Explorer once you start profiling.
When profiling an ASP.NET application, the Event View panel displays events that occur in the ASP.NET process and in the profiled application. One important thing about this is that all displayed general events occurred in the ASP.NET process, while all .NET specific events occurred in the profiled ASP.NET application. (For detailed information on general events and .NET specific events, see Event View Panel).
In the default configuration, IIS works as a service. It does not close when you close Internet Explorer, so AQTime does not generate profiling results. To obtain the results, select Run > Get Results from AQTime’s menu.select AQTime > Get Results from the main menu of Visual Studio.select AQTime > Get Results from the main menu of RAD Studio. Another way to obtain the results is to create an action that will “tell” AQTime to generate the results. See Getting Results During Profiling for more information.
-
To terminate the profiler run, select Run > Terminate from AQTime’s main menu or press
 Terminate on the Standard toolbar.select AQTime > Terminate from the main menu of Visual Studio.select AQTime > Terminate from the main menu of RAD Studio.
Notes on Using the Allocation Profiler
Your application may contain classes inherited from the System.Web.UI.Page or System.Web.HttpApplication class. If you include these inherited classes in profiling tasks and profile your .NET application with the Allocation profiler, you may note that AQTime does not report any instances of the inherited classes that are created.
This happens because the ASP.NET process does not create instances of your classes, which are inherited from System.Web.UI.Page or System.Web.HttpApplication. It creates instances of temporary classes that are inherited from your classes. Since your classes are not created, the profiling results are empty for them. However, the Allocation profiler automatically includes temporary classes in profiling tasks and traces the creation and deletion of their instances. By viewing profiling results for temporary classes, you can see how the application used your classes during the profiler run.
The names of temporary classes inherited from System.Web.UI.Page have the following format:
ASPXFileName_aspx,
where ASPXFileName is the name of the .aspx file (excluding the file extension) that refers to your class. For instance, the XMLTrace sample application includes the XMLTrace.aspx file that refers to the XMLTraceForm class defined in XMLTrace.aspx.cs. The name of a temporary class inherited from the XMLTraceForm class will be XMLTrace_aspx.
The names of temporary classes inherited from System.Web.HttpApplication have the ASAXFileName_asax format. For example, the XMLTrace application includes the Global.asax file that holds a reference to the Global class defined in Global.asax.cs. The name of a temporary class inherited from Global will be Global_asax.
See Also
Profiling ASP.NET Applications
Profiling ASP.NET Applications via ASP.NET Development Server