AlertSite business benchmark reports enable you to compare your website and API availability and response time – two of the most telling performance metrics – against well-known companies in your industries and against the top 25 US websites such as Amazon, Facebook, Wikipedia, and others. Market indexes for comparison include:
|
|
|
Benchmark metrics include the website availability, and the web page response time as the time required to view a fully rendered home page, including HTML, CSS, JavaScript, images, and third-party objects. Data is collected every 15 minutes, 24/7, from multiple locations around the globe.
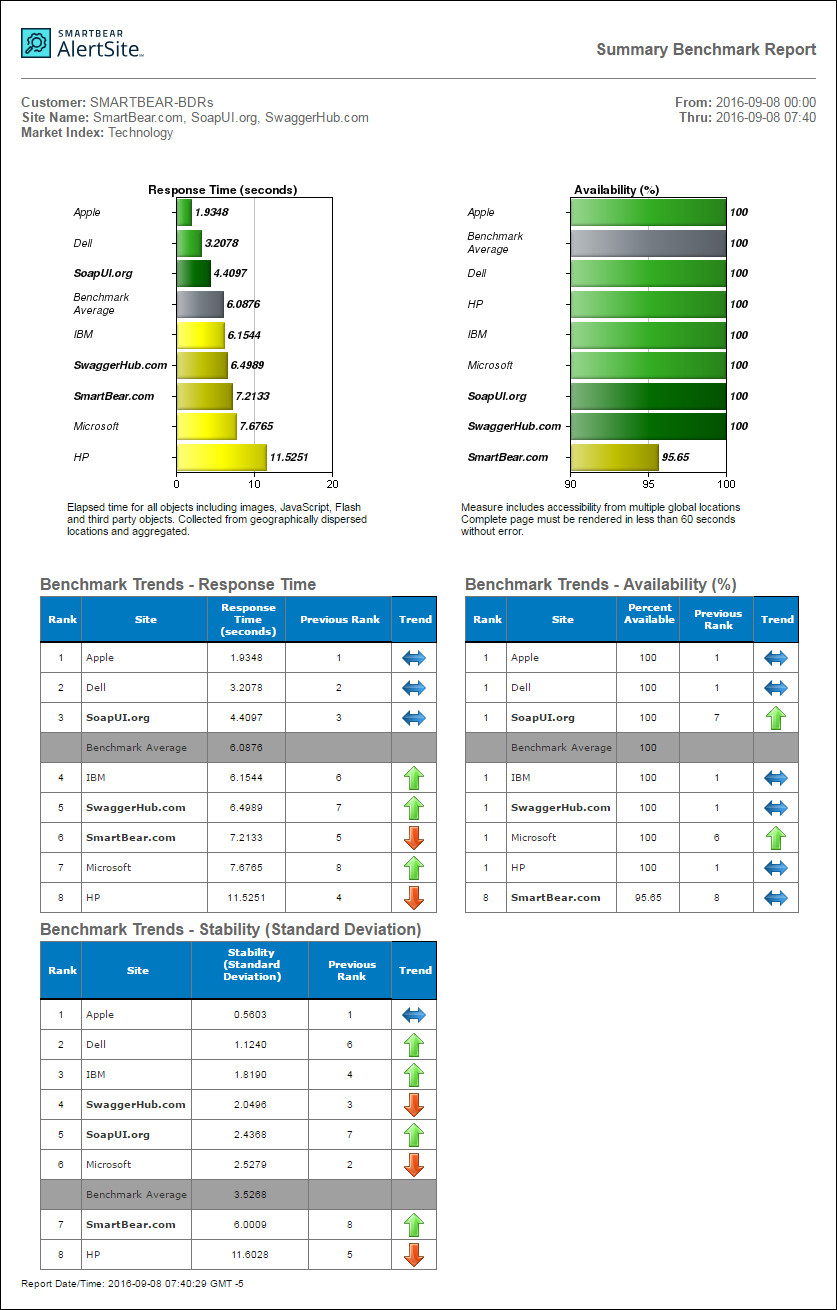
Here is a sample summary report that compares three of our monitors (bold font) to the Technology market index for a single day and includes the graphs, trends, and stability:
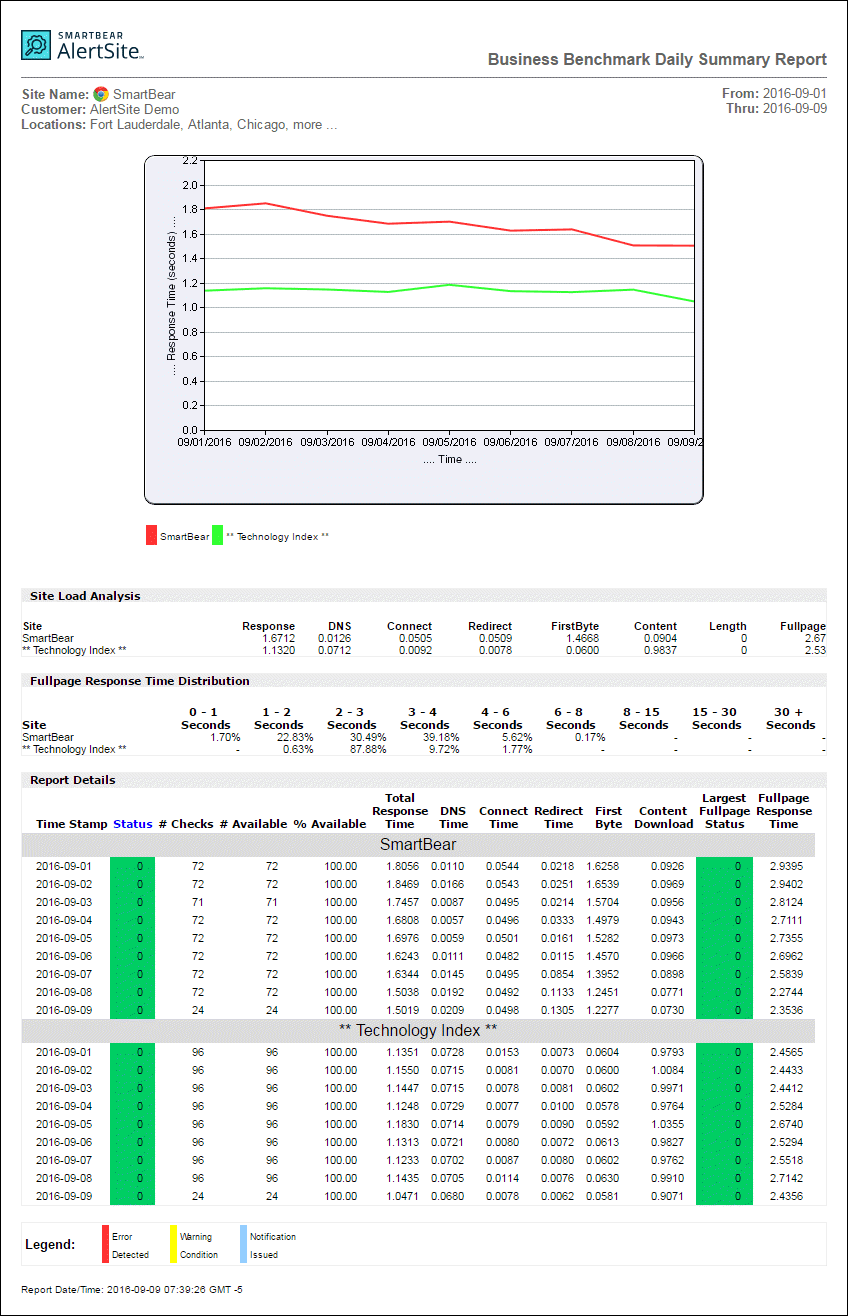
This is another report that compares the daily summary and network timings of our SmartBear site and the Technology market for a period of 9 days:
AlertSite Plans with Business Benchmarks
All AlertSite users have access to the basic Business Benchmarks Summary (or Benchmark Report V2.0 in AlertSite 1.0) that lets you select up to 5 of your monitors to compare with the market indexes of the Top 25 US Sites (for website monitors) or APIs and Web Services (for SoapUI monitors) over the last week.
AlertSite Enterprise customers can also purchase an optional Business Benchmarks plan to get:
-
The full suite of 21 market indexes listed above.
-
Customizable date ranges for the reports.
-
Additional benchmark reports displaying daily, hourly or detail data with the exact network timings (DNS time, redirect times, and so on).
For details, please contact your AlertSite Sales Representative. To view the contact information, select > AlertSite 1.0 from the top menu of AlertSite UXM, then go to Support > Support Center.
Supported Monitor Types
| Report Type | Monitor Types | ||
|---|---|---|---|
| Web URL * | Real-browser (DéjàClick) * | SoapUI | |
| Business Benchmark Summary | ✔ | ✔ | ✔ |
| Business Benchmark Daily | ✔ | ✔ | |
| Business Benchmark Hourly | ✔ | ✔ | |
| Business Benchmark Detail | ✔ | ✔ | |
* Only monitors with the full page response time monitoring (enabled by the Fullpage Interval option).
Create Benchmark Reports
You can create benchmark reports under Reports > Performance Reports in AlertSite UXM. If you are using AlertSite 1.0, navigate to Reports > Business Benchmarks. You can create these reports manually or schedule them to be generated and emailed to you automatically.
To create a benchmark report manually:
AlertSite UXM
-
Navigate to Reports > Performance Reports.
-
Configure the report as follows:
-
Report type – Business Benchmarks Report
-
Benchmark report type:
-
Business Benchmarks Summary – Shows graphs and trend analysis for up to 5 of your monitors against the sites in the selected market index.
-
Users with the optional Business Benchmark plan can also select these reports:
- Business Benchmarks Daily
- Business Benchmarks Hourly
- Business Benchmarks Detail
These reports display the graphs and network timings similar to the Daily, Hourly, and Detail reports, but include data from up to 8 of your monitors compared to the selected market index.
-
-
Benchmark ID – The market index for comparison, for example, Top 25 US Sites. Available market indexes depend on whether you have the Business Benchmarks plan.
-
Monitors – Select up to 5 monitors for the Summary report or up to 8 monitors for the Daily, Hourly, or Detail report.
-
The APIs and Web Services benchmark supports SoapUI monitors only.
-
All other benchmarks require website or real-browser (DéjàClick) monitors with the fullpage monitoring.
-
-
Locations – Select the monitoring locations whose data will be included in the report.
-
The Detail report is limited to one location.
-
The Daily and Hourly reports support multiple locations.
-
The Summary report always uses all locations, so this option is ignored.
-
-
Date range – The date range for the report. Possible ranges depend on the report type and your AlertSite plan.
-
Report options – The components to be included in the report.
For the Summary report:
-
Graphs – Graphs comparing the average response time and availability of your monitors to the industry competitors.
-
Trends – Trend analysis, showing whether the response time and availability improved, declined or remained the same as compared to the previous period of the same length (today vs yesterday or this month vs last month and so on).
-
Stability – The standard deviation of the response time, that is, how spread the numbers are. This is a measure of consistency and uniformity of the customer experience.
For the Daily, Hourly, or Detail report:
-
Report Details – The network timings and monitoring status for each report interval (daily average, hourly average, or every monitor run).
-
Fullpage Time Distribution – The distribution of the full page response time across ranges from 0 to 30+ seconds.
-
Graphs – A graph of the response time over time.
-
Site Load Analysis – Average network timings over the report period.
-
Status Summary – How many times each monitor status code was received.
-
-
-
Click Run Report.
-
Once the report is ready, you can view it as a web page (HTML) or as PDF, email it or schedule it to run regularly.
AlertSite 1.0
-
Navigate to Reports > Business Benchmarks.
-
Select the benchmark type:
-
Benchmark Report V1.0 – Displays graphs and timings and includes data of up to 8 monitors, which can be a combination of your own sites along with benchmark sites from the selected industries. This report type is available only if you have purchased the optional Business Benchmark plan and has three subtypes:
- Detail Report
- Hourly Summary Report
- Daily Summary Report
Click the Benchmark Report V1.0 button to edit the Benchmark Report V1.0 settings.
-
Benchmark Report V2.0 – The default benchmark report type that shows graphs and trend analysis for up to 5 monitors against the benchmark sites within a specific market index. This report type is available to users without the Business Benchmark plan but with certain limitations which include the Top 25 US Sites, graphs and trends, and the Date Range of Last week (Monday through Sunday).
-
-
Configure the report as follows:
-
Click Create Report.
-
Once the report is ready, you can view it as a web page (HTML) or as PDF, email it, or schedule it to run regularly.
The created report is also added to your Document Manager.


 Benchmark Report V1.0