ServerAgent is a component of Private Node Server that monitors the location health and resource usage. If your private location misses a scheduled monitor run, or if it stops communicating with AlertSite, an alert will be sent to the selected recipients.
ServerAgent is not enabled by default, you need to configure it manually. This guide explains how you can do this.
Notes:
-
Currently, you can view the ServerAgent status and reports only in AlertSite 1.0 (the classic interface). You cannot view them in AlertSite. However, alerts will come anyway.
-
Connectivity alerts can be used instead of or in addition to ServerAgent.
Requirements
Network connectivity
ServerAgent uses the following ports for outbound communication through the firewall:
| Port | Protocol | Destination | Purpose |
|---|---|---|---|
| 443 | TCP |
privateagent.alertsite.com privateagent.jupiter.alertsite.com |
To register the ServerAgent in AlertSite. Note: privateagent endpoints have dynamic IP addresses. Firewall rules must use the domain names and not their current IP addresses. |
| 4892 | TCP | Primary and secondary location configured for this ServerAgent (see below). | For outbound performance data and status of Private Node Server ServerAgent. Data is sent as encrypted XML. |
 |
ServerAgent does not use the proxy server configured for the Private Node Server. It uses a direct outbound connection. |
Plan availability
Before you begin, verify that you have an available (free of charge) plan that lets you use ServerAgent on your private nodes:
-
In AlertSite UXM, select > Settings > Plan Details from the top menu.
-
You should see the ServerAgent 5 w/ InSite plan in the list.
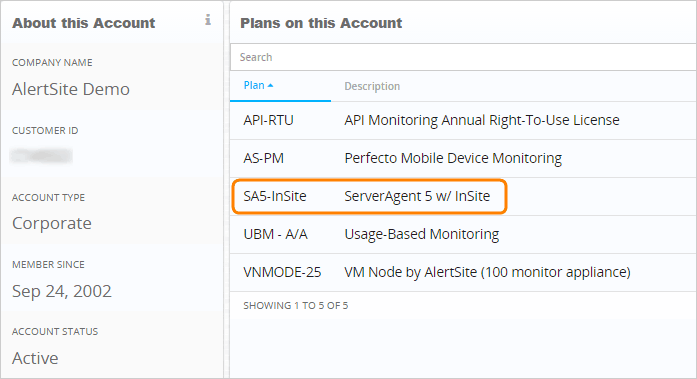
If you do not see the plan, please contact Customer Support or your AlertSite Sales Representative immediately.
Generate a monitor ID for ServerAgent
Once the ServerAgent plan is in place, you can configure ServerAgent to monitor your Private Node Server. First, you need to generate a Device (Monitor) ID in the AlertSite console:
-
In AlertSite UXM, select > AlertSite 1.0 from the top menu to switch to the classic interface.
-
Go to Configuration > ServerAgents.
-
Click Add a New ServerAgent.

-
Enter your ServerAgent parameters:
-
Site Name – a name for ServerAgent that will be displayed in AlertSite dashboards and reports.
-
Site Plan – select the Server Agent 5 w/ InSite plan. If you do not see the plan, contact your AlertSite Sales representative.
-
Monitoring Is – set to Enabled.
-
Notify on Error? – set to Yes. You will receive alerts when ServerAgent detects a problem with your Private Node Server.
-
Reporting Interval – specify how often (in minutes) ServerAgent should check in with AlertSite to report results and indicate that it is up and running. If ServerAgent has not reported in at the expected interval, a 4050 - server not responding error occurs.

-
-
Click Submit in the top right corner.
-
This will generate a Device ID for your ServerAgent.
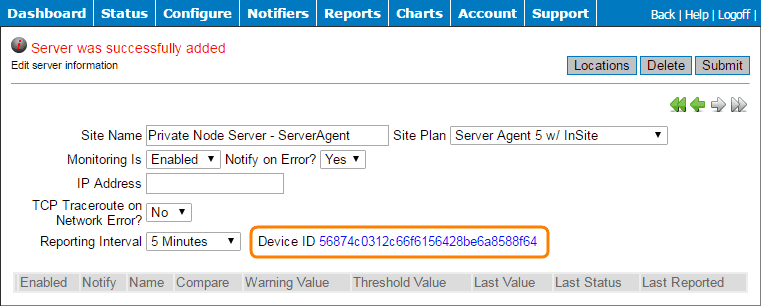
-
Copy this value somewhere – you will need it later.
Select a location to receive data
ServerAgent does not send data directly to the AlertSite platform. It sends it to one of AlertSite global monitoring locations, and from there, the data gets to AlertSite. The location is selected automatically on the previous step, but you can change it. Note that if your Private Node Server is behind a firewall, you must allow outgoing communication to this location through port 4892 (see Network Connectivity).
To view or change the location to which ServerAgent sends data:
-
In AlertSite 1.0, on the ServerAgent configuration page, click Locations in the top right corner.
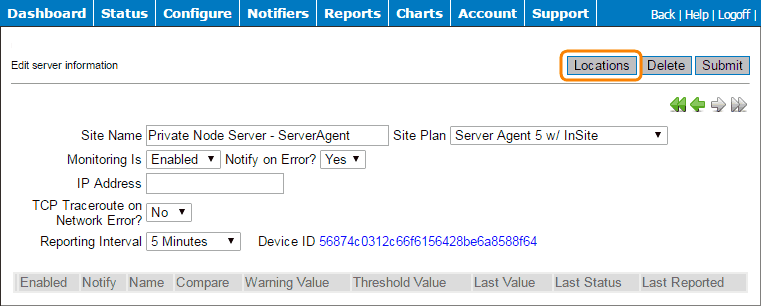
-
Note down the first location in the list – it is marked as Primary.

-
(Optional.) If you want to change the location, select the radio button next to another location and click Submit.
Note: If you are a Usage-Based Monitoring customer and you select a location outside the United States, Canada or Europe, you will consume additional measurement credits for each ServerAgent check.
-
To find the secondary location:
-
Go to Reports > Performance Reports.
-
Select your ServerAgent in the list.
-
Note down the secondary location that is displayed.
Note: The secondary location is assigned automatically and cannot be changed.
-
-
On the Monitoring Locations - IP Addresses page, find these locations and note down all of their IP addresses.
-
Configure your firewall to allow outgoing traffic on port 4892 to all the IPs listed.
Note that if you change the location at any time later, you will have to update the firewall rules to allow connections to the new location.
Register & start ServerAgent on Private Node Server
-
Navigate to https://<IP address>, where <IP address> is the IP address of your Private Node Server.
-
Go to ServerAgent > Register ServerAgent.
-
Enter the Device (Monitor) ID that you copied from AlertSite earlier and click Register.
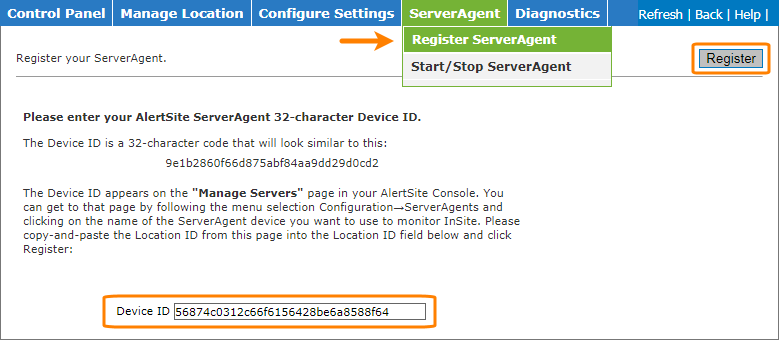
-
After ServerAgent is registered successfully, click the link to start it.

-
After a few minutes, the ServerAgent information in AlertSite will update to include the configuration section at the bottom of the page.
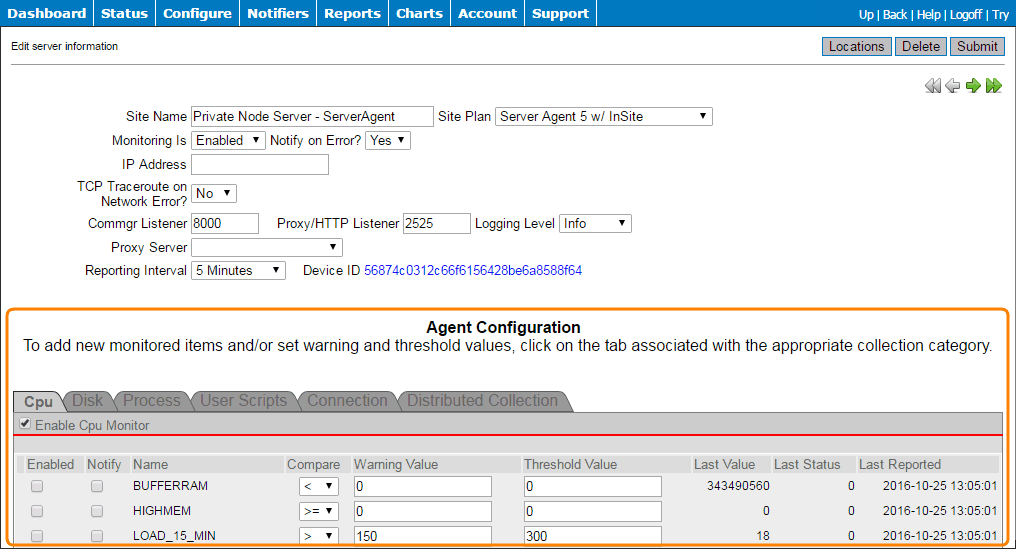
-
On this page, switch to the User Scripts tab.
-
Select the Enable User Scripts Monitor check box.
-
Make the following changes in the first (blank) line:
-
Select the Enabled and Notify check boxes.
-
Enter lastsend.sh in the Name column.
-
Change the Compare operator to
>or>=. -
Change Warning Value to 15.
-
Change Threshold Value to 20.
This means that ServerAgent will report a warning condition if your Private Node Server has not reported to AlertSite for 15 minutes, and an error condition if has not reported for 20 minutes or more.

Note: You may use different Warning and Threshold values, but do not make them lower than 20 minutes + the shortest run interval of monitors on your private node. Also, note that if your shortest run interval is 10 minutes, the data may not be sent until the next 10-minute check. -
-
Click Submit in the top right corner.
ServerAgent starts working immediately. There is no need to reboot Private Node Server, and there is no loss of monitoring.
| Note: | You may receive one or two alerts initially while the system syncs up the connection to ServerAgent |
View the ServerAgent status
You can see the most recently reported status of your ServerAgents on the Status > ServerAgents screen in AlertSite 1.0 (the classic interface).

To view historical data, you can run the ServerAgent Detail report in Reports > Performance Reports. Note that the report is limited to one week of data.
ServerAgent status codes
The following status codes are returned for problems detected by ServerAgent:
| Status Code | Description |
|---|---|
| 4050 | Server is not responding (see Troubleshooting below). |
| 4040 | Error threshold exceeded. |
| 4030 | Warning threshold exceeded. |
Alerting
 To get notified of possible connectivity loss, we recommend using connectivity alerts instead of ServerAgent.
ServerAgent sends alerts to warn you about potential issues with your Private Node Server. These alerts are similar to monitor alerts, but use the status codes mentioned above.
To receive alerts, you need to have alert recipients configured.
Note that by default, ServerAgent sends alerts to all the recipients configured in your AlertSite account. To limit the number of recipients, create a recipient group for ServerAgent.
Troubleshooting
Test connection through port 4892
ServerAgent sends outgoing performance data through port 4892.
In Private Node Server 2.0.2 and later:
-
Open the Control Panel (web interface) of your private node by navigating to https://<IP address>, where <IP address> is that of your private node.
-
From the top menu, select Diagnostics > Connection Tests.
-
Wait until the results are displayed. ServerAgent test results are displayed at the end of the table.
In earlier versions:
-
Find which AlertSite locations your ServerAgent sends data to (see above). There are two locations, primary and secondary.
-
On the Monitoring Locations - IP Addresses page, find all the IP addresses for these locations.
-
Open the Control Panel (web interface) of your private node by navigating to https://<IP address>, where <IP address> is that of your private node.
-
From the top menu, select Diagnostics > Diagnostic Tests.
-
Run a Traceroute to ip_address 4892, replacing ip_address with one of the AlertSite location IP addresses from step 2.
-
The traceroute results appear in a new window. Verify that the connection goes past your firewall.
-
Repeat the test for the other IP addresses of that location.
If there are connection problems, make sure your firewall allows traffic from the private node to the specified ServerAgent hosts through port 4892. You can also try restarting the private node or the ServerAgent.
Restart ServerAgent
Sometimes, restarting ServerAgent may solve connection problems. To restart ServerAgent:
-
Navigate to https://<InSite IP address>, where <InSite IP address> is the IP address of your Private Node Server.
-
Go to ServerAgent > Start/Stop ServerAgent and click Stop.
-
Go to ServerAgent > Start/Stop ServerAgent again and click Start.
Note that restarting the private node itself will also restart the ServerAgent.
See Also
Private Node Server
Registering a Private Location in AlertSite
Configuring Private Node Server on Your Network
