
AlertSite API monitors run API tests created with ReadyAPI or SoapUI to check your API availability, correctness, and response time from multiple locations around the globe. You can monitor both SOAP and REST APIs.
This tutorial explains how to create an API test, configure content assertions for API results, and upload the test to AlertSite for monitoring. We will use the Country web service as an example:
 http://www.webservicex.net/country.asmx
It is a SOAP web service, but the procedure for REST web services is similar.
We will use ReadyAPI to create and configure the API test project. You can download a trial version of ReadyAPI here.
| Note: | If you already know how to create ReadyAPI test cases with assertions, or if you have an existing API test to use, skip to step 4. |
Before You Begin
To create tests for a SOAP API, you need a WSDL file. The WSDL file describes API operations, parameters, the returned data structure, and other information about the API.
You can usually access the WSDL file by appending ?WSDL at the end of the web service URL. For example, if the web service URL is:
http://www.webservicex.net/country.asmx
then the WSDL file is here:
1. Create a Project in ReadyAPI
Let’s start by creating a project in ReadyAPI:
-
Select File > New SOAP Project from the main menu.
-
Enter the Project Name, for example, CountryAPI.
-
In the Initial WSDL text box, enter: http://www.webservicex.net/country.asmx?WSDL.

-
Click OK.
Your project should look like the following image. You can see that the API has two interfaces for different SOAP versions – countrySoap for SOAP 1.1 and countrySoap12 for SOAP 1.2.

Click the image to enlarge it.
2. Create a Test Suite With a Test Case
Now we need to create a test case that would run API operations and verify their result.
Let’s create a test case for the GetCountryByCountryCode operation. This operation converts a two-letter country code to the country name (for example, FR to France).
To create a test case:
-
In the project tree, right-click countrySoap12 and select Generate TestSuite.
-
Select Create new empty requests.
-
Under Operations, click Unselect all, then select GetCountryByCountryCode.

-
Click OK.
-
You will see a message asking you to enter a name for the test suite. We will use the default name, so just click OK.
Now we have a test case with one step that calls the GetCountryByCountryCode operation.

Many API operations have parameters. Be sure to specify the parameter values in the corresponding test steps. If parameter values are missing, the API may return errors.
In our example, the GetCountryByCountryCode operation has one parameter – a two-letter country code. Let’s use FR as this parameter value:
-
Double-click the GetCountryByCountryCode test step. This opens the request editor.
-
In the CountryCode text box, enter FR.

Click the image to enlarge it.
3. Create an Assertion
API tests should include assertions to check that the API works correctly and returns the correct results. Without assertions, the test checks only the API availability, but not the returned data.
Let’s verify that the GetCountryByCountryCode operation returns the correct results. In our example, it should convert FR to France. We already specified FR as the input parameter, so now let’s create the assertion:
- Click in the request editor to run the request. You will see the response in the right-side panel.
-
In the response, right-click GetCountryByCountryCodeResult (the innermost item) and select Add Assertion > for Content.

Click the image to enlarge it.
-
In the dialog that appears, review the Expected Result – it should contain France.

-
Click Save.
You should see the ![]() green circle on the Assertions tab at the bottom of the request editor. This means the assertion has been successfully validated.
green circle on the Assertions tab at the bottom of the request editor. This means the assertion has been successfully validated.

4. Upload Project to AlertSite UXM
Now that you have a working ReadyAPI test, you can upload it to AlertSite for monitoring.
You can do this:
-
From ReadyAPI, if you have version 1.3 or later.
a. Uploading From AlertSite
First, export your ReadyAPI project to a ZIP file:
-
In ReadyAPI, select Project > Export from the main menu.
-
Specify the ZIP file to create.
Then, in AlertSite:
AlertSite UXM
-
On the Dashboard, hover over + Add New and select Monitor.
-
Select API and click Upload and Monitor.

Click the image to enlarge it.
-
Select your AlertSite plan and click Continue.
Note: For internal APIs monitored only from private locations, select the VM Node or InSite plan. -
Browse for your zipped API project and click Submit File.
-
Select your test case and click Next.

-
Enter the monitor name and how often it should run and click Create.

-
On the screen that follows, click Test on Demand. This will run the test from a remote location to ensure the monitor can work from arbitrary locations.
Note: This is only required if your SoapUI monitor will run from AlertSite global locations. If you selected the VM Node or InSite plan for your monitor, skip this test. 
-
If the test fails, review the errors and fix your ReadyAPI test appropriately, then export and upload the project again.
Congratulations! You have just created your first API monitor. It will start collecting data shortly, and you can see the results on the AlertSite dashboards.

AlertSite 1.0
-
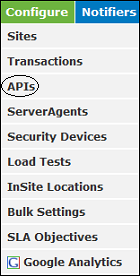
From the top menu, select Configure > APIs.
-
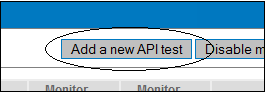
Click Add a new API test at the upper right.
-
The Add a New API Device page will appear. It has a field where you can select a project file to be uploaded to the AlertSite monitor:

Click the image to enlarge it.
-
Click the Choose File button.
-
Navigate to the folder where you stored the zip project file.
-
Click the Upload Project File button.
-
The Project file section indicates that the upload was complete and a new section for selecting the test suite and test case will appear:

Click the image to enlarge it.
-
Choose a test suite and test case from each drop-down list.
-
Click the Create API Device button.
A new tab with the Manage API device page will be created so that you can easily select additional test suites and test cases from the Add a New API Device page and create additional API monitors without having to re-enter the page. The Manage API device screen will appear as:

Click the image to enlarge it.
To monitor from AlertSite global locations:
-
Click the Test On Demand button to run a test of the API from a remote location.

-
The Test On Demand screen will close immediately after a successful test, and the page will display:

If the test is not successful, the Test On Demand screen will persist so that you can click the View test results button to determine the nature of the error. You need to resolve the errors before the API monitor can be enabled and upload the project again.
 Re-upload the Project
To monitor from private locations (Private Node Server or InSite):
-
Select a plan from the Site Plan drop-down list (VM Node or InSite).
-
Click the Locations button at the upper right to display the Monitoring Locations list.
-
Deselect default locations and select your private location, making it Primary.
-
Click Submit at the upper right, and then return to the Manage API device screen by clicking on the API monitor name at the upper left.
-
Select the InSite plan from the Site Plan dropdown.
-
Select Enabled from the Monitoring Is dropdown.
-
Click Submit.
A successful Test On Demand run is not required.
b. Uploading From ReadyAPI (Using AlertSite Connector Plugin)
ReadyAPI v. 1.3 and later include the AlertSite Connector plugin. With this plugin, you can create API monitors in AlertSite directly from ReadyAPI:
-
In ReadyAPI, switch to SoapUI NG.
-
Click Monitor APIs on the toolbar. This will open the AlertSite Connector:

Click the image to enlarge it.
-
Enter your AlertSite email and password and click Connect.

Click the image to enlarge it.
You will see the Connected to AlertSite message on successful login.
Now you can create an API monitor from your test:
-
Click Add Monitors in the top left.

Click the image to enlarge it.
-
In the dialog that appears, configure your monitor:
-
Select the Project, Test suite, and Test case to run.
-
Enter the Monitor name and select how often the test should run (every 1 to 120 minutes, depending on your plan).
-
If you have several plans, select the Plan to use for this monitor.
-
Click Add.

-
You will see the API Status page with your monitor added. The monitor will start running shortly, and you will see its status.

Click the image to enlarge it.
If you need to change the monitor settings (run interval, monitoring locations, and so on), use the Click here link to open AlertSite, and proceed from there. For details, see Editing a Monitor.
Useful Configuration Options
You may want to change the monitor settings in AlertSite to best fit your API monitoring needs:
-
Capture Level – Set this to Error Only or All Steps on Error. This will include SoapUI logs in monitor run results to help troubleshoot errors.
-
Locations, Monitoring Mode, and Rotate Locations – Select the locations to run your test from and specify whether to use these locations simultaneously or in turns.
-
Enable Local Retry – Specify whether to repeat the test on error.
-
Alerting On/Off – Specify whether to send alerts on error. If you use alerting, be sure to configure email recipients with the Attach server response to e-mail alerts option. This will include the SoapUI log in email alerts, to help with troubleshooting.
For a complete list of settings, see SoapUI API Monitor Settings.
Use SSL Certificates and Keystores
If your API requires a client-side SSL certificate or a keystore, you need to upload the certificate or keystore to AlertSite and assign it to your API monitor. For details, see Using SSL Certificates and Java Keystores.
View SoapUI Logs
AlertSite stores SoapUI test logs to help troubleshoot API test failures. The logs contain full HTTP request and response data, assertion results, and any errors that occurred.
A SoapUI log is attached to email alerts if email recipients have the Attach server response to e-mail alerts option selected. You can also review the logs in AlertSite if the monitor has Capture Level enabled.
To view SoapUI logs in AlertSite, go to Monitors > Runs and select your monitor. Expand a failed run, then click Detail Report.

Click the image to enlarge it.
In the report that opens, click the ![]() camera icon.
camera icon.

Click the image to enlarge it.
The next screen lets you access SoapUI logs. View Step Log opens the log of just that step, and View Run Log opens the log of the whole run, including all step logs.

Click the image to enlarge it.
Below is an example of a step log. You can see that the test failed, because the API response did not contain the expected value.

Click the image to enlarge it.