Google Analytics is a web analytics service by Google that helps analyze website visitor traffic for marketing or other purposes. It has a free version and a paid subscription, Google Analytics 360 Suite.
AlertSite integration with Google Analytics lets you view your Google Analytics metrics overlaid with the website response time and availability measured by AlertSite. You can view the data overlay on the charts on the AlertSite Dashboard.
Considerations
-
Google Analytics integration is available free of charge to customers on the Usage-Based Monitoring plans.
-
To configure the integration, you must be an Admin, Co-Admin, or Power User in AlertSite, and must have a Google account with access to Google Analytics or Google Analytics 360 Suite.
-
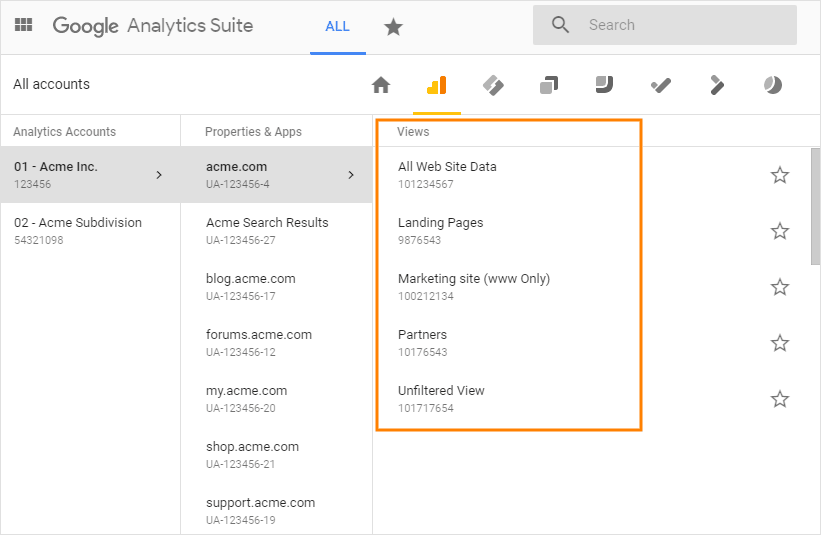
The integration assumes that you have configured views in Google Analytics for the websites you are monitoring with AlertSite. You will need to map the Google Analytics views to the corresponding website monitors in AlertSite.
Configuration
Integrating AlertSite with Google Analytics includes the following steps:
-
Generate a Google client ID and client secret.
-
Specify your Google client ID and client secret in AlertSite.
-
Map Google Analytics views to AlertSite monitors.
Generate Google client ID and secret
To integrate AlertSite with Google Analytics, you need a Google client ID and client secret. Follow these steps to generate them:
-
Open the Google API Console at https://console.developers.google.com/apis/dashboard. If you are not logged in to Google yet, log in.
-
If you have multiple Google Accounts, switch to the account you use with Google Analytics.
-
Click Create Project.
-
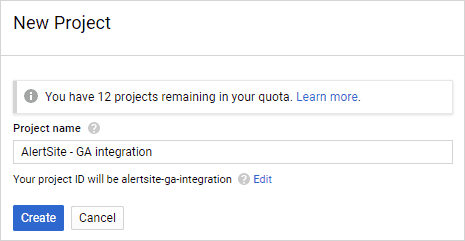
Enter a name for the project, for example, AlertSite - GA integration, and click Create.
-
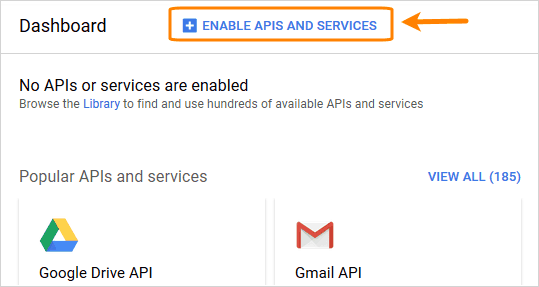
Click Enable APIs and Services at the top of the Dashboard.
-
Search for analytics and select the Analytics API on the list.
-
Click Enable.
-
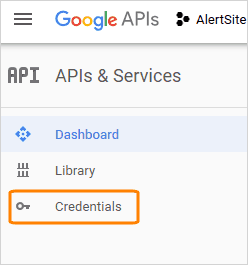
In the navigation bar on the left, select Credentials.
-
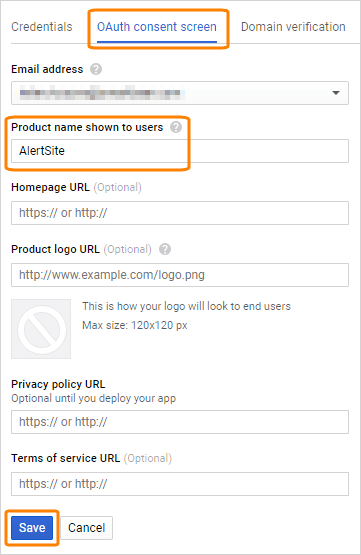
Switch to the OAuth consent screen tab.
-
Enter AlertSite as the product name, optionally, fill out other fields, and click Save.
-
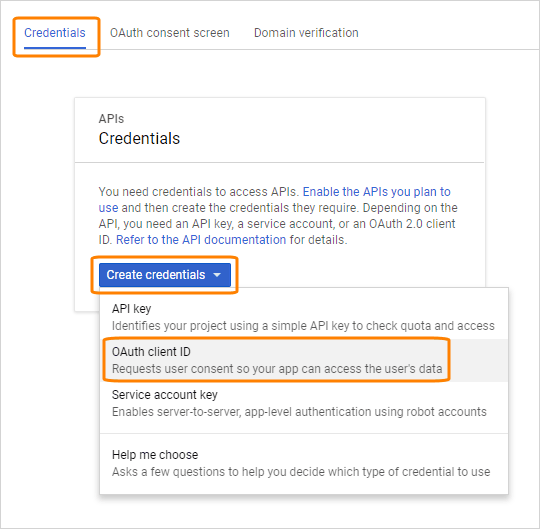
Switch to the Credentials tab, click Create credentials and select OAuth client ID.
-
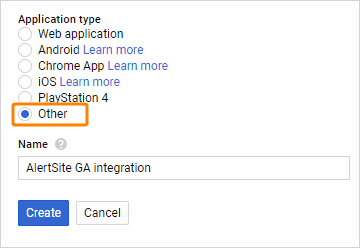
Select Other, enter an arbitrary name (for example, AlertSite GA integration), and click Create.
-
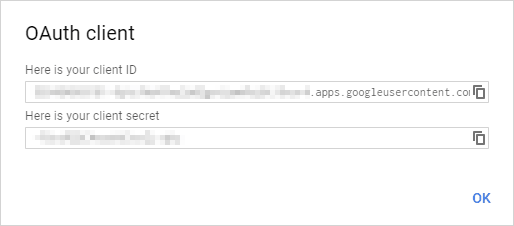
Google will generate a client ID and client secret for you. You will need to specify these values in AlertSite.
Authorize AlertSite to access Google Analytics
AlertSite UXM
-
Go to > Settings and switch to the Google Analytics tab.
-
Click Add Account.
-
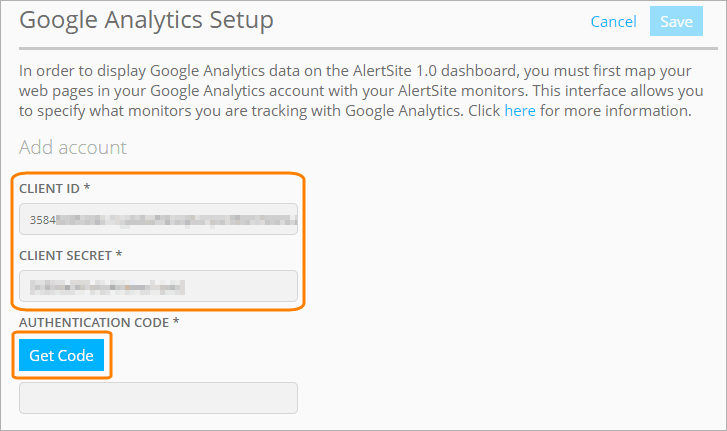
Enter the Google client ID and client secret that you generated earlier, and click Get Code.
-
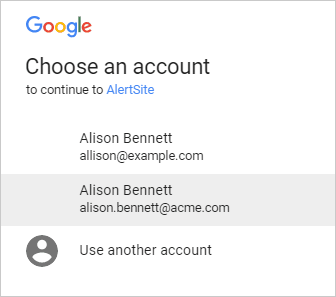
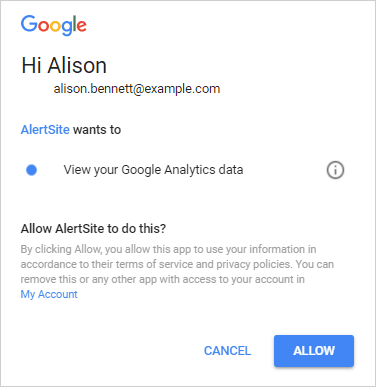
You will be redirected to the Google consent page. If you have multiple Google accounts, select the account you used to generate the client ID and secret earlier.
-
Click Allow to confirm access to your Google Analytics data.
-
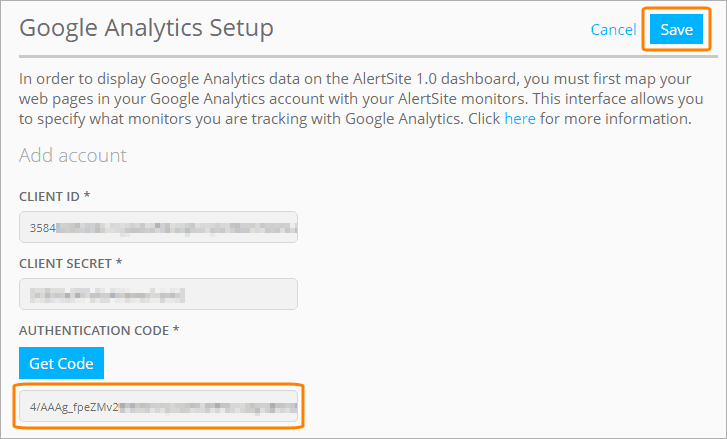
Copy the generated code.

-
Paste this code into the Authentication Code field in AlertSite and click Save.
AlertSite 1.0
Previously, it was possible to set up Google Analytics integration using a Google email address for authentication. This approach is no longer supported. Email-based accounts are marked DEPRECATED and need to be updated to use the Google client ID and client secret. Monitor mappings configured in the deprecated accounts will be preserved with the new credentials.
Follow these steps to add a new Google Analytics account or update a deprecated account:
-
Go to Configure > Google Analytics.
-
To add a new account, click Add Account:

To convert an existing DEPRECATED account, select this account on the list and click Edit Account:

-
Enter the Google client ID and client secret that you generated earlier and click Get Code.
-
You will be redirected to the Google consent page. If you have multiple Google accounts, select the account you used to generate the client ID and secret earlier.

-
Click Allow to confirm access to your Google Analytics data.

-
Copy the generated code.

-
Paste this code into the Authentication Code field in AlertSite, and click Save.
Map Google Analytics views to AlertSite monitors
Now, you need to specify which Google Analytics views correspond to which AlertSite monitors. You can add or change these mappings at any time.
AlertSite UXM
-
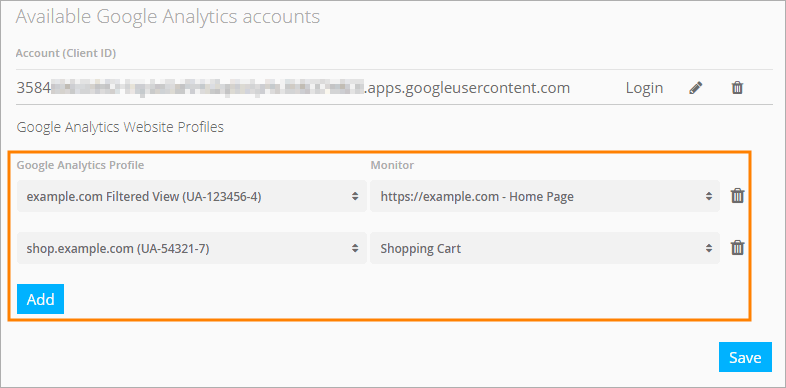
Click Login next to your Google client ID. This will display the options to map Google Analytics views to AlertSite monitors.
-
The mapping configuration displays two lists:
-
The Google Analytics Profile list on the left displays all views that exist in your Google Analytics account.
-
The Monitor list on the right contains all your website monitors (single URL and DéjàClick monitors).
-
-
Click Save to save the configuration.
AlertSite 1.0
-
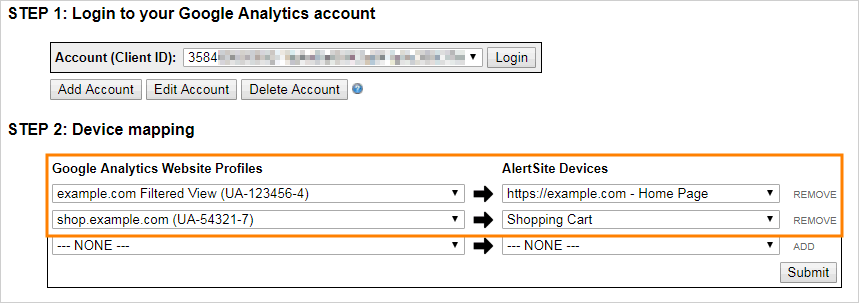
Click Login next to your Google client ID. This will display the options to map Google Analytics views to AlertSite monitors.

-
The mapping configuration displays two lists:
-
The Google Analytics Website Profiles list on the left displays all views that exist in your Google Analytics account.
-
The AlertSite Devices list on the right contains all your website monitors (single URL and DéjàClick monitors).
-
-
Select an AlertSite monitor and a Google Analytics view that correspond to the same website or area of the website. Click Add to add more mappings, or Remove to remove a specific mapping.
Tip: Different monitors can be mapped to the same Google Analytics view if needed. -
Click Submit to save the configuration.
View Google Analytics metrics in AlertSite charts
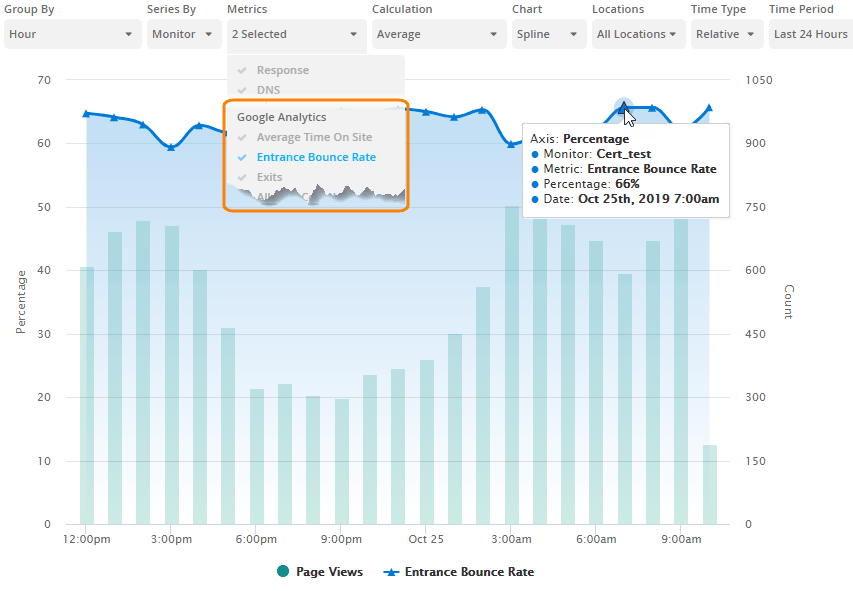
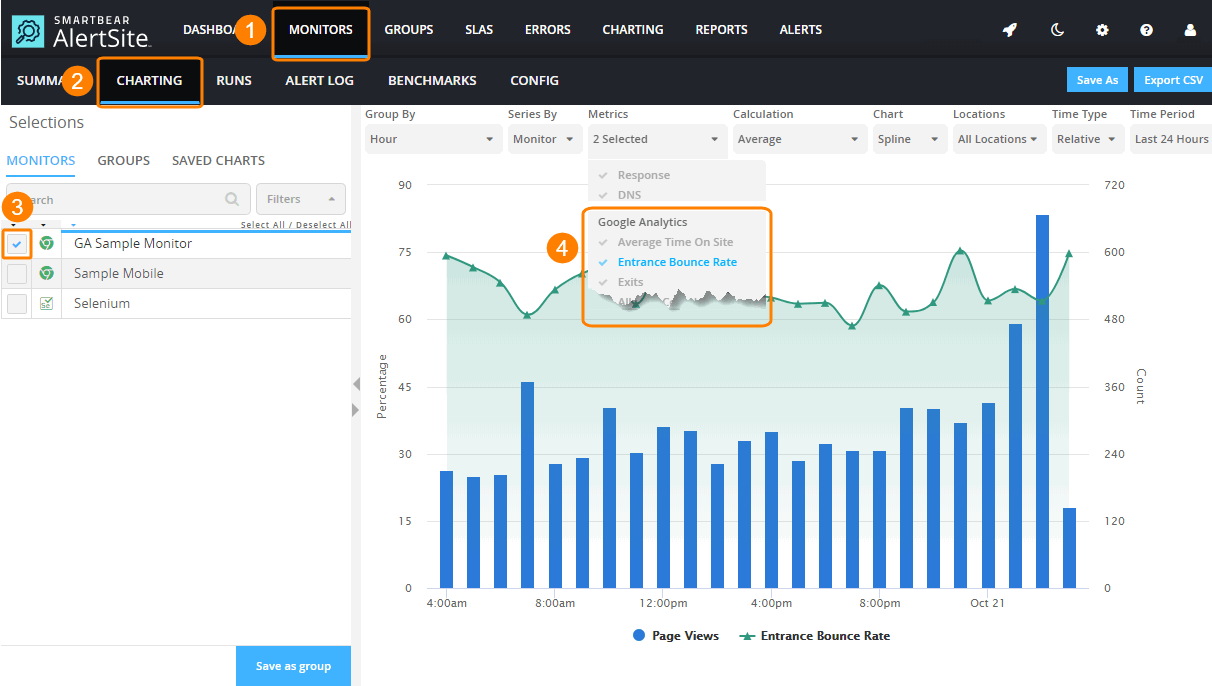
AlertSite fetches the Google Analytics data and overlays the data on a graph. Customers can see the data only in their own accounts.
To view charts with Google Analytics data:
AlertSite UXM
-
Click Charting in the AlertSite header.
-
On the left, select one or more monitors that have been associated with Google Analytics views.
-
Select the desired Google Analytics metrics from the Metrics list.
-
Configure other charting options as required.
You can hover over the data points on the chart to see the exact values of AlertSite and Google Analytics metrics for the corresponding period (hour or day).
AlertSite 1.0
-
Open the Dashboard.
-
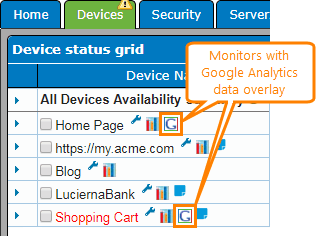
Monitors included in Google Analytics integration are displayed with the
 icon on the Dashboard. Clicking this icon will open the Google Analytics integration settings.
-
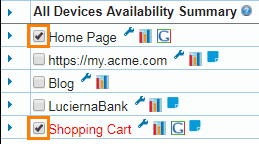
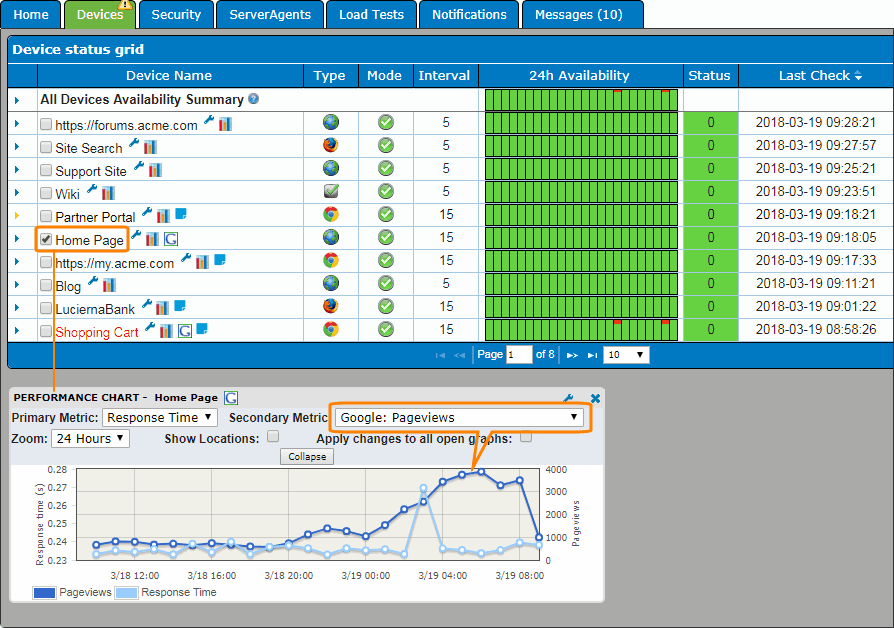
Select the check boxes to the left of the monitor names:
-
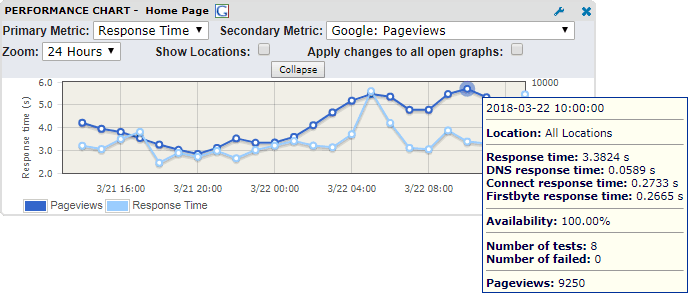
Charts with the monitor metrics and Google Analytics data overlay will appear at the bottom of the Dashboard.
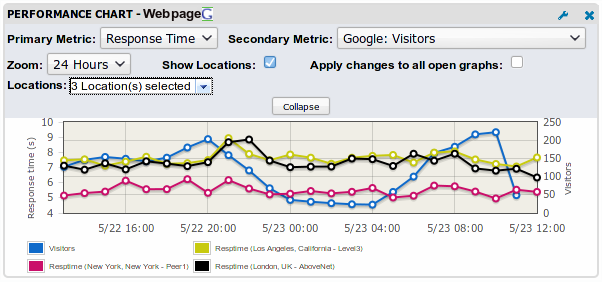
The charts allow you to select one AlertSite metric (either Performance or Availability) and one of the available Google Analytics metrics to see how they correlate. By default, the charts display response time vs Google Analytics Pageviews over the last 24 hours.
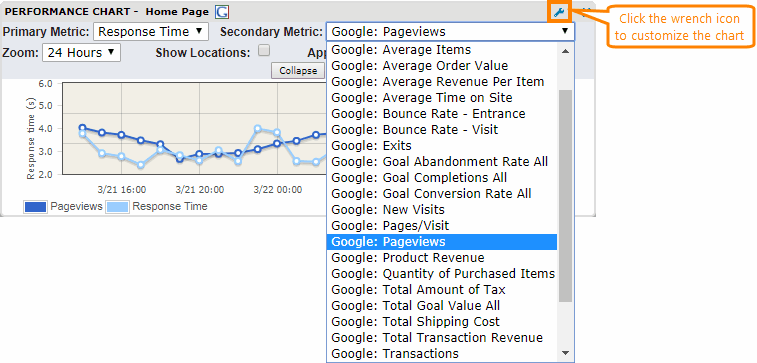
To change the selected Google Analytics metric, click the wrench icon in the top right corner of the chart, then select the desired metric on the list.
Hover over the data points on the chart to see the exact values of AlertSite and Google Analytics metrics for the corresponding period (hour or day).
Chart options
Click the wrench icon in the top right corner of a chart to view or change the chart options.
Primary Metric
Possible values: Response Time and Availability.
Response Time refers to the full page response time if the monitors use full page monitoring, and base response time otherwise.
Secondary Metric
Select one of the available Google Analytics metrics to overlay on the chart. Default is Pageviews. See Supported Google Analytics Metrics below for a list of supported Google Analytics metrics, and Dimensions & Metrics Reference for a description of these metrics.
Zoom
Select the time frame for the chart: 24 Hours, 7 Days, 14 Days or 30 Days. The 24 Hour chart displays hourly averages, others display daily averages.
Show Locations
By default, the chart shows the average response time or availability across all monitoring locations selected for this monitor. To view per-location metrics, select the Show Locations check box. You can customize the displayed locations by using the Locations list.
Locations
Displayed only if the Show Locations check box is selected. Contains a list of locations used by the monitor and lets you show or hide specific locations on the chart.
Apply changes to all open graphs
Click this button to apply the current chart’s configuration to other charts displayed on the AlertSite 1.0 Dashboard.
Chart display mode
AlertSite 1.0 Dashboard can display Google Analytics data charts in one column or two columns. To change the display mode:
-
Click
 Tab Preferences in the top right corner of the Dashboard.
 -
Choose the desired Graph display mode: Extended (1-column) or Standard (2-column). Other options do not apply to the Google Analytics data charts.
-
Click Save.
Supported Google Analytics metrics
The following table lists the Google Analytics (GA) metrics currently supported by AlertSite. For a description of these metrics, refer to Google Analytics Dimensions & Metrics Explorer.
| Metric name | GA dimension | GA metric ID |
|---|---|---|
| Abandoned Funnels | Goal | ga:goalAbandonsAll |
| Average Order Value * | Ecommerce | ga:revenuePerTransaction |
| Average Quantity * | Ecommerce | ga:itemsPerPurchase |
| Average Revenue Per Item * | Ecommerce | ga:revenuePerItem |
| Average Time on Page * | Page Tracking | ga:avgTimeOnPage |
| Bounce Rate * | Session | ga:bounceRate |
| Bounces | Session | ga:bounces |
| Exits | Page Tracking | ga:exits |
| Goal Completions | Goal | ga:goalCompletionsAll |
| Goal Conversion Rate * | Goal | ga:goalConversionRateAll |
| Goal Value | Goal | ga:goalValueAll |
| New Users | User | ga:newUsers |
| Pages / Session * | Page Tracking | ga:pageviewsPerSession |
| Pageviews | Page Tracking | ga:pageviews |
| Product Revenue | Ecommerce | ga:itemRevenue |
| Quantity Purchased | Ecommerce | ga:itemQuantity |
| Sessions | Session | ga:sessions |
| Shipping Cost | Ecommerce | ga:transactionShipping |
| Tax | Ecommerce | ga:transactionTax |
| Transaction Revenue | Ecommerce | ga:transactionRevenue |
| Transactions | Ecommerce | ga:transactions |
| Unique Pageviews | Page Tracking | ga:uniquePageviews |
* 24-hour average value.
Privacy notes
AlertSite access to view customer Google Analytics data combined with AlertSite data is restricted to designated AlertSite employees who have authorized access rights and are under non-disclosure agreements.

 Google Analytics views