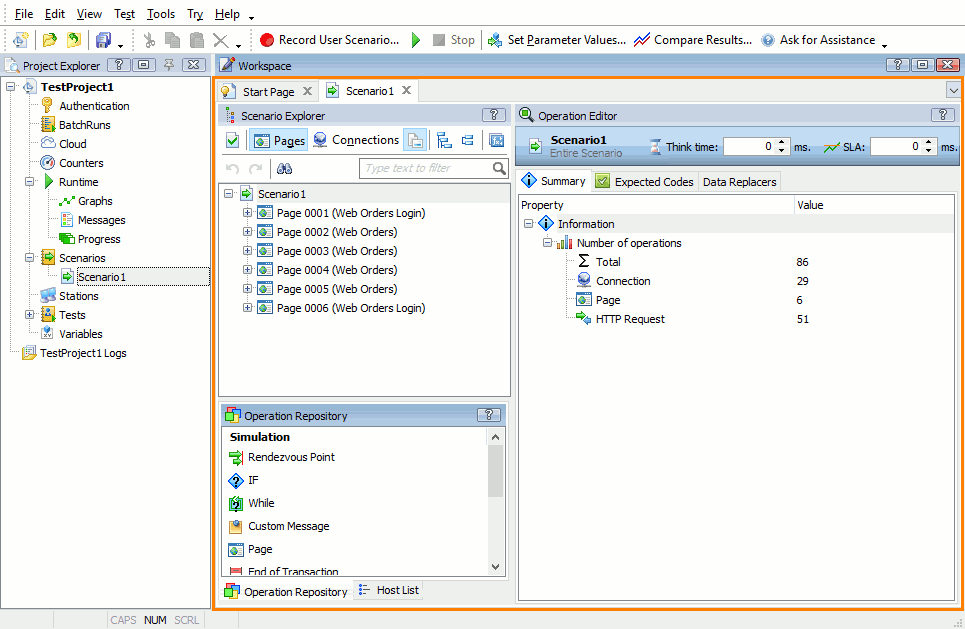
You can examine the recorded traffic both during the recording, and after you finish it. To open the recorded scenario, double-click the scenario in the Project Explorer. LoadComplete displays the scenario in the Scenario editor.
The scenario consists of requests sent to the test server during the recording. You can select any request and examine it on the Request page.
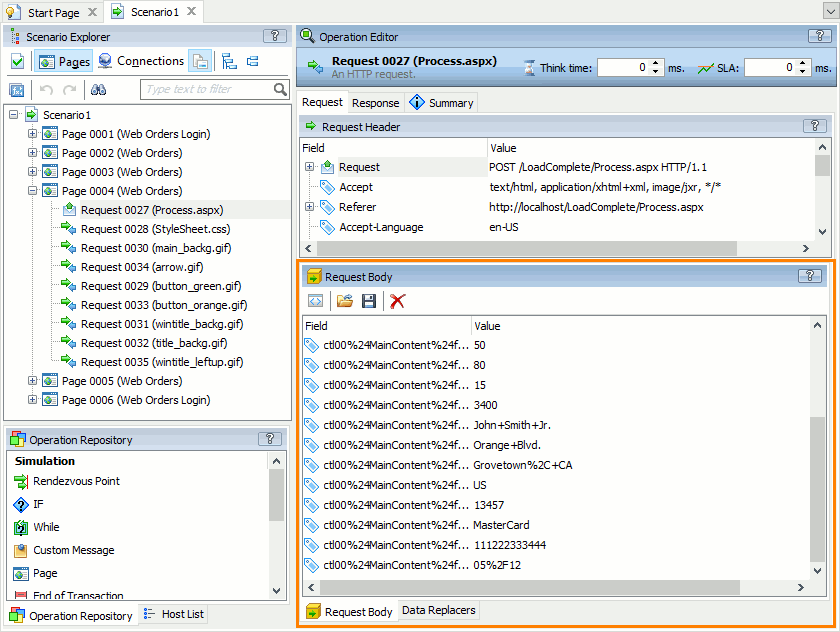
For a POST request, you can view and edit parameters passed to the tested web server:
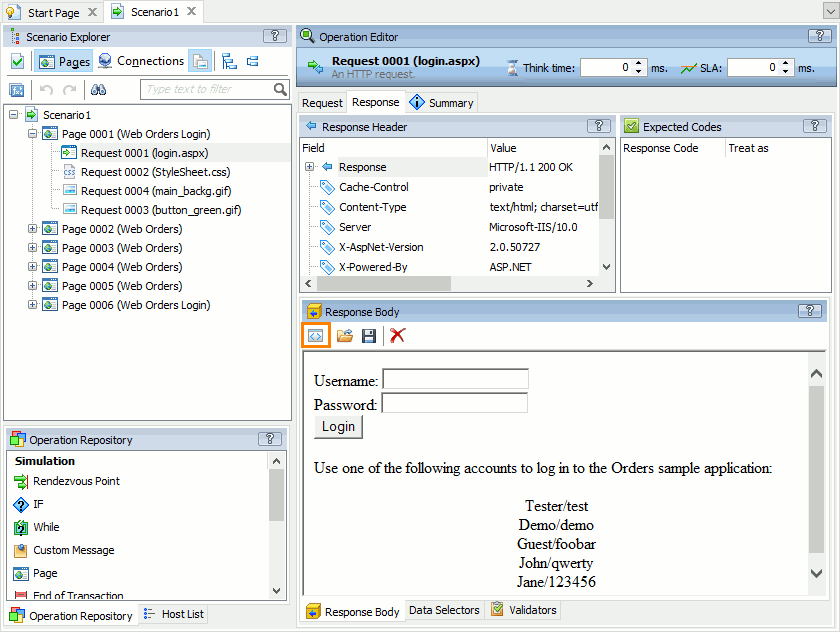
The Response page shows detailed information on the response obtained for the request. For instance, it contains the source code of the web page opened when the specified request was sent. To view the sample preview of the page, uncheck the  item on the panel’s toolbar:
 |
The preview of the recorded pages can look different from the way these pages look in web browsers. This is because the preview neither loads external resources, such as images or stylesheets, nor executes scripts. |
LoadComplete automatically detects concurrent connections that are established by the application to send requests to the server. This makes traffic simulation closer to real life. For more information on working with concurrent requests, see Configuring Parallel Requests.
For each load web page, established connection, and sent request, LoadComplete shows the “think time”.
For web pages, for example, the think time is the period passed after the previous web page was loaded completely and before the current page started loading. LoadComplete captures the think time values automatically when you are recording a scenario.


 Prev
Prev