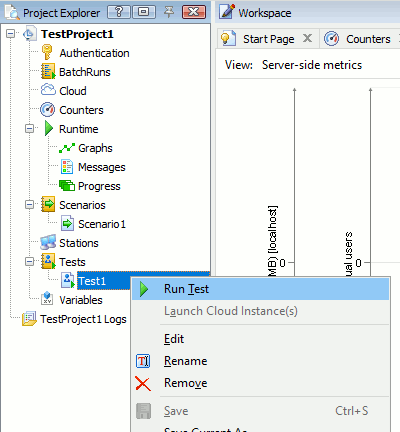
Now, we will run the load test created at the previous step of this tutorial. Right-click the test in the Project Explore panel and then click Run Test1.

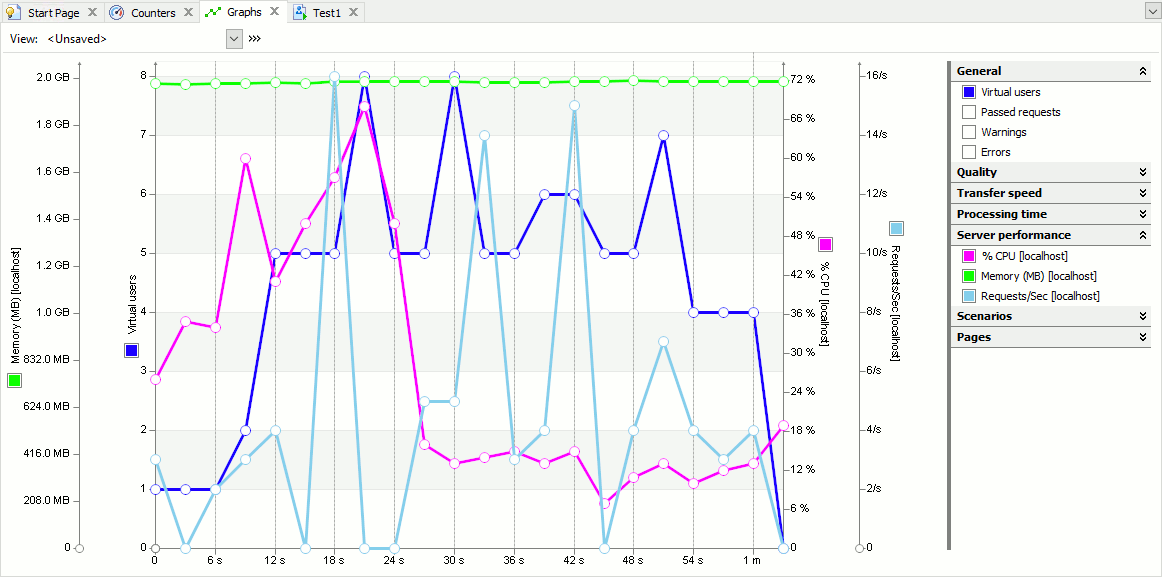
After you start the test run, LoadComplete will automatically switch to the Runtime > Graphs page that displays the values of the monitored performance metrics:
You can hide or show the metrics on the graph by selecting or clearing the corresponding check boxes in the list on the right.
For more information on working with the Graphs page and its elements, see Monitoring Performance Graphs.
See Also
Running Load Tests
About Server Monitoring
Managing Server-Side Performance Counters


 Prev
Prev