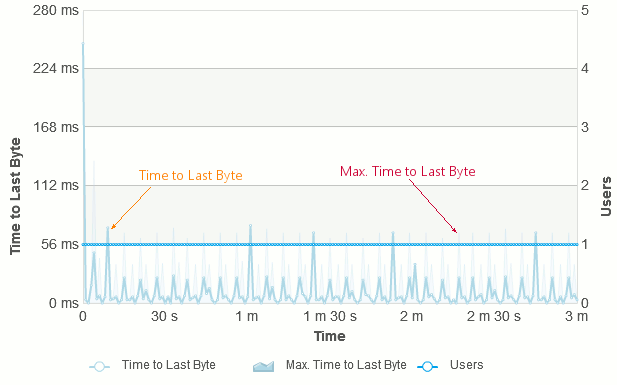
The Time to Last Byte section of the Report panel shows the relation between the number of virtual users, the Time to last byte metric and the test execution time. The Time to last byte metric represents the time that elapsed between the first byte of an outgoing request and the last byte of the incoming response.
Viewing the Graph
-
Open the desired Report item (if it is not open yet). To do that, expand the test log item node under the Project_Name Logs folder in the Project Explorer and double-click its child Report node.
-
In the Report panel, select the Response Time tabbed page.
-
Expand the Time to Last Byte section.
Requirements
To view the graphs and charts shown in the Report panel, install Flash Player 8 or later for Windows Internet Explorer on your computer. You can download the latest version of the player from the Adobe web site:
Pages
The Time to Last Byte section contains several tabbed pages that show the Time to last byte statistics in different modes.
With Virtual Users Page
The graph on this page shows the time to last byte and the number of virtual users at any moment of the test run.

The thin line, Max. Time to Last Byte, represents the maximum time to last byte for all the requests that LoadComplete was simulating at that moment.
The thick line, Time to Last Byte, represents the average time to last byte for all the requests that LoadComplete was simulating at that moment.
If the average and maximum values are equal, the graph shows only the average values.
You can show and hide individual graph lines by clicking the line name in the graph legend.
| Note: | You can view the page load time on the Runtime > Graphs page during the test run. |
To see the exact value of a metric at a specific moment, hover the mouse pointer over the needed data point on the graph - a tooltip showing the metric value will appear.
To see detailed information on requests simulated at a specific moment, click the needed data point on the graph. The graph will show the list of request simualted at that moment, their server think time, status and so on in a popup window.
| Note: | This information will be available only if you configure LoadComplete to gather detailed information on requests and responses during simulation. To do this, set the Store log data option to All data (Report + Details). |
Printing the Contents of the Report Panel
Note that LoadComplete shows the data shown in the graph in the tabular format. An appropriate table is shown under the Time to Last Byte graph when you start printing the contents of the Report panel, that is, when you click Print on the panel's toolbar.
The above-mentioned table contains the following columns:
| Column | Description |
|---|---|
|
Time |
Contains time values from 0 to the test execution time in increments of one second. |
|
Time to last byte |
Contains the value of the Time to last byte metric at the specified moment. |
|
Users |
Contains the number of virtual users that were simulated at the specified moment. |
More Information
For more information on working with the graphs and charts shown in the Report panel, see Viewing the Report Charts and Graphs.
Scroll Chart Page
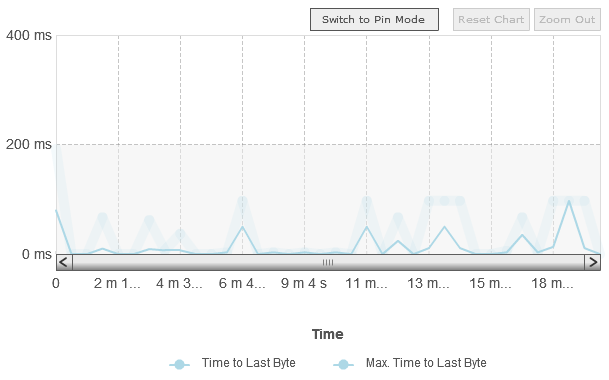
This page contains a graph that represents the value of the Time to last byte metric at any moment of the test run. A sample view of the graph is as follows:

Note that the graph contains only the exact values of the Time to last byte metric obtained during the test run (these values are shown on the Runtime > Graphs page of the project at runtime).
You can zoom this graph in and out. You can also select the desired area of the graph and then overlay it with another area. For more information on working with scroll graphs, see Working With Scroll Graphs.
Chart by Region Page
This page contains graphs organized by Amazon cloud regions.
The graphs show the number of virtual users and time to last byte in each region at any moment of the test run. Bold lines indicate average time to last byte, thin lines indicate maximum time to last byte. If the average and maximum values are equal, the graph shows only the average values.
| Note: | This page is available only when you run tests on a cloud computer and on a local workstation, or on cloud computers that belong to a different region. |
You work with these graphs in the same way you work with the graphs on the With Virtual Users tabbed page. For more information, see the section above.
Data Table Page
This page contains a table that represents the data of the graphs displayed on the With Virtual Users page. For a detailed description of its columns, refer to the description of the graphs.
 |
This tab is not visible in LoadComplete. To view its contents, export your test results to an external file. |
See Also
Response Time Page of the Report Panel
Report Panel
About Test Results
Working With Scroll Graphs
Resolving Errors and Warnings
Test Result Panels
Creating and Configuring Load Tests

