
Switch to the Summary panel. It will “tell” you how much resources the application did not release and how may errors occurred when calling Windows API functions that deal with resources:

Click the image to enlarge it.

Click the image to enlarge it.

Click the image to enlarge it.
The Resource profiler organizes results into three categories: Classes Data, Objects and Errors. Select the Classes Data category in the Explorer panel. In the Report panel, AQTime displays information about resources that remained in memory at the moment the results were being generated:
")
Click the image to enlarge it.
")
Click the image to enlarge it.
")
Click the image to enlarge it.
The Class Name column holds the type of the resource (bitmap, device context, icon, etc). The Live Count column shows the number of resource handles that existed in memory when the application terminated. To quickly find all the unallocated resources, sort records in the Report panel on this column:

The other columns show information about the size of live resources, the total number of created resources of the given type, the peak number and the peak size, etc. The size columns make sense only for functions that allocate memory resources, for instance, CoTaskMemAlloc or CoTaskMemReAlloc. That is why, for example, the Live Size and Total Size columns of the Report panel hold zeros for DC resources. Note that by default, the Report panel does not hold all available columns. For information on how to make them visible, see Adding and Removing Columns.
Now let’s continue the analysis. Select the Objects category in the Explorer panel. The Report panel will display information about resource instances that remained in memory after the application terminated. That is, it shows information for each resource leak that was detected. If you profiled the Visual C++ sample, the panel will contain three records:If you profiled the Visual C++ sample, the panel will contain three records:If you profiled the Borland Delphi sample, the panel will contain two records:
")
Click the image to enlarge it.
")
Click the image to enlarge it.
")
Click the image to enlarge it.
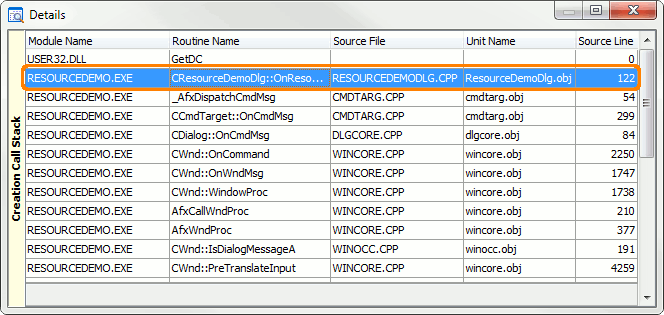
Let’s find the source-code statement that allocated the DC resource. To do this, click on the DC resource in Report and switch to the Details panel. It will show the stack of function calls that lead the call to the function that allocated the resource:

Click the image to enlarge it.

Click the image to enlarge it.

Click the image to enlarge it.
For each routine in the call stack AQTime shows the module that holds this routine, the name of the source file that holds the routine’s code and the line number, at which the routine’s code starts in this source file. Note that information on source files and lines is not available if AQTime has no debug information for a function or if a function was called from a module that was not added to your AQTime project (for example, these can be operating system libraries such as gdi32.dll, user32.dll, etc).
The topmost function in the call stack is the function that allocated the resource. As you can see, in our example it is the GetDC routine that is located in user32.dll. To find what routine called it from your code, scroll the call stack down until you find a routine that is located in your source file. In our case, this is the CResourceDemoDlg::OnResource function that is located in the ResourceDemoDlg.cpp file.In our case, this is the CResourceDemoDlg::OnResource function that is located in the ResourceDemoDlg.cpp file.In our case, this is the TForm1::btnResourceLeakClick function that is located in the Main.pas file.
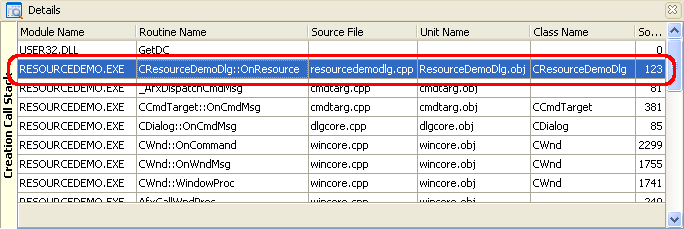
To see the source code of this routine, double-click it in the Details panel. AQTime will bring up the Editor panel and position the cursor on the first line of the routine’s source code:

Click the image to enlarge it.

Click the image to enlarge it.

Click the image to enlarge it.
As you can see, OnResource allocates the device context, but does not release it. To fix the bug, call ReleaseDC at the end of OnResource.
Using the described approach you can find the function that failed to execute correctly and caused an error, which AQTime detected and displayed information about it in the Report panel. To do this:
- Select the Error category in the Explorer panel.
- Click the desired error in the Report panel.
- Switch to the Details panel and find the routine that failed to execute successfully.
- View the source code of this function in the Editor panel.
 Prev
Prev