
When explaining how to work with the Resource profiler, we will use a sample application, ResourceDemo, which is installed along with AQTime.
Unmanaged Examples
 <AQTime Samples>\Unmanaged\Resource\VC2005 - Microsoft Visual C++ (Visual Studio 2005 project)
<AQTime Samples>\Unmanaged\Resource\VC2013 - Microsoft Visual C++ (Visual Studio 2013 project)
<AQTime Samples>\Unmanaged\Resource\Delphi - Borland Delphi
<AQTime Samples>\Unmanaged\Resource\BCB - Borland C++Builder
| Note: | You can also open Visual Studio samples in later versions of Visual Studio. |
 |
On Windows Vista and later, AQTime samples are located in the <Users>\Public\Documents\AQTime 8 Samples folder. On other operating systems, the samples reside in the <Documents and Settings>\All Users\Documents\AQTime 8 Samples folder. |
In this tutorial, we will speak about the Visual C++ version of ResourceDemo, but this is simply to avoid repetition. These instructions can be applied to all three tools.
In this tutorial, we will speak about the Visual C++ version of ResourceDemo, but this is simply to avoidrepetition. These instructions can be applied to all three tools.
In this tutorial, we will speak about the Borland Delphi version of ResourceDemo, but this is simply to avoid repetition. These instructions can be applied to all three tools.
To profile this example with AQTime, do the following:
-
Open the application in AQTime.
-
Select Resource Profiler from the Profilers drop-down list on the Standard toolbar.
Select Resource Profiler from the Profilers drop-down list displayed in the AQTime menu of Microsoft Visual Studio.
Select Resource Profiler from the Current Profiler submenu displayed in the AQTime menu of Embarcadero RAD Studio.
-
Select
 Normal from the Profiling Mode drop-down list box displayed on AQTime’s Standard toolbar.
Select
Normal from the Profiling Mode drop-down list box displayed on Visual Studio’s AQTime toolbar.Click the
Normal button on RAD Studio’s AQTime Profiling Modes toolbar. -
Switch to the Collect Stack Information Pane shown to the middle right of the Setup panel and make sure that both the All Project Modules check box and the corresponding Collect info about lines radio button are selected.
-
Click
 Run on the Standard toolbar.
Select
Run from Visual Studio’s AQTime menu, or press Visual Studio’s  Run button while any of AQTime panels is active.
Select Run With Profiling from Embarcadero RAD Studio’s AQTime menu.
-
Depending on the Show Again Flags options, AQTime may call the Profiler Options dialog. In the dialog, check all the resource categories and click Run to start profiling.
-
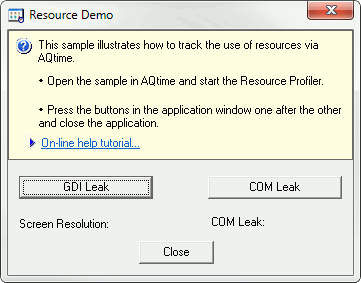
AQTime will launch the profiled application. When the application’s window appears on screen, press all the buttons in succession and then close the application.
AQTime will generate profiling results. We will analyze them at the next step.
 Prev
Prev