Take a look at DoActionC, for instance, in the C# implementation of our sample application. This routine takes near 0.6%0.6%0.6% of the total time without children and about 13.6%13.6%14.3% of the total time with its child calls included. (To view the percents within the % Time and % with Children columns, right-click the column header and select the proper display style from the context menu). It means that most of the time outlay is for child routines that are called from the DoActionC routine. Therefore, we need to spend some time reviewing the routines called from DoActionC.
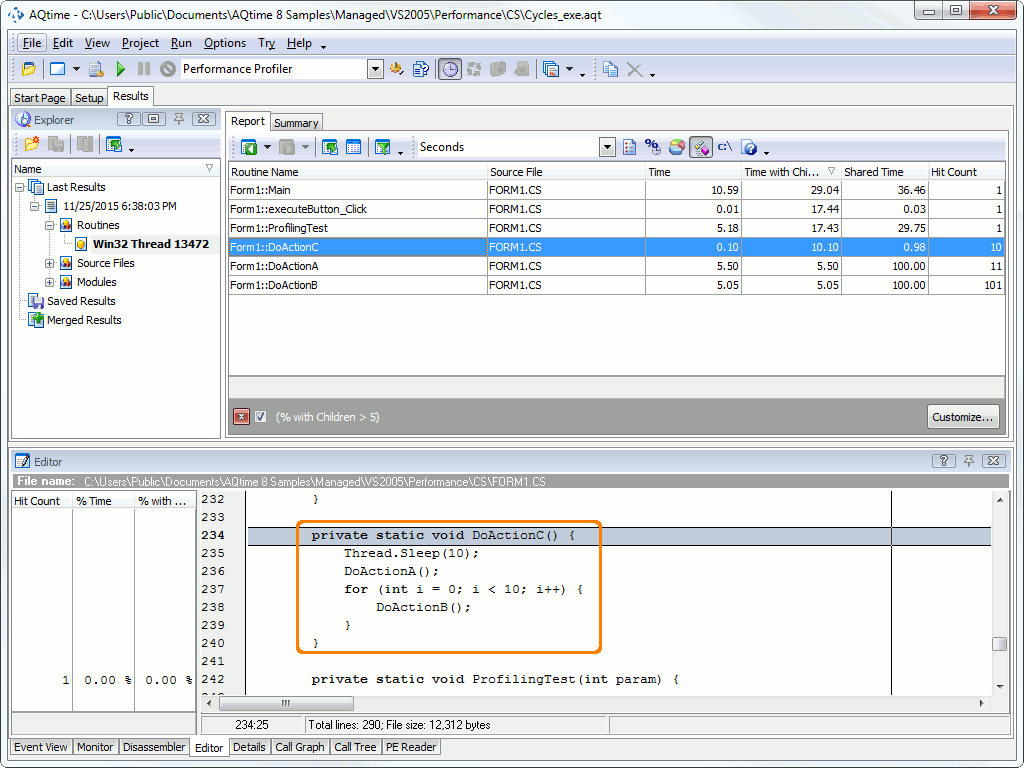
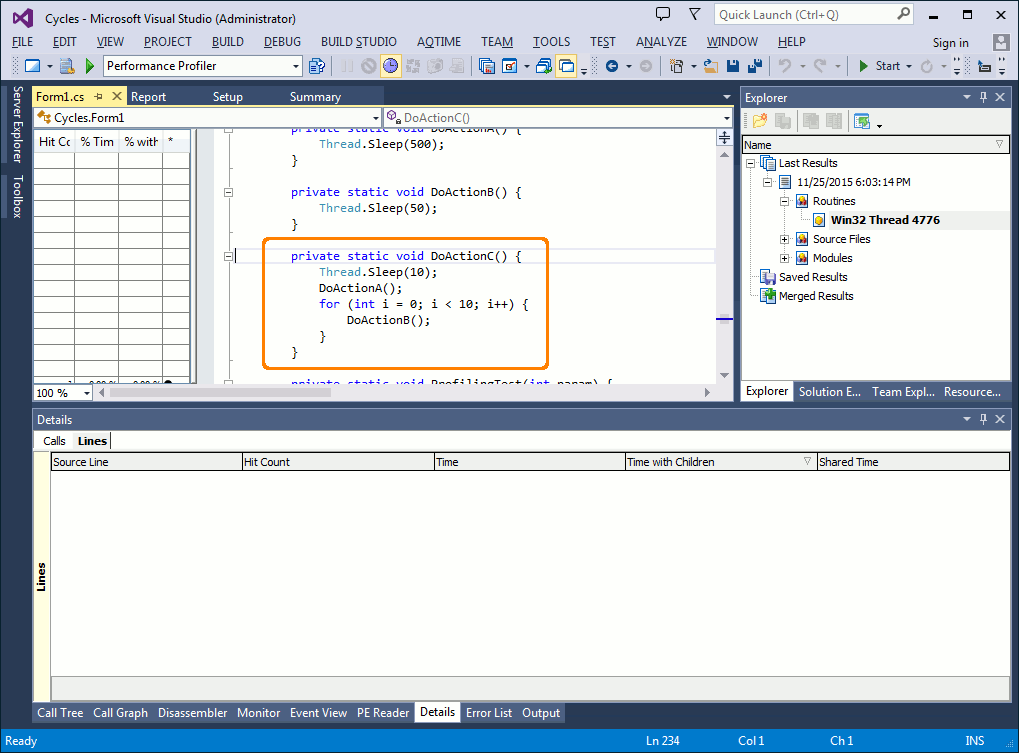
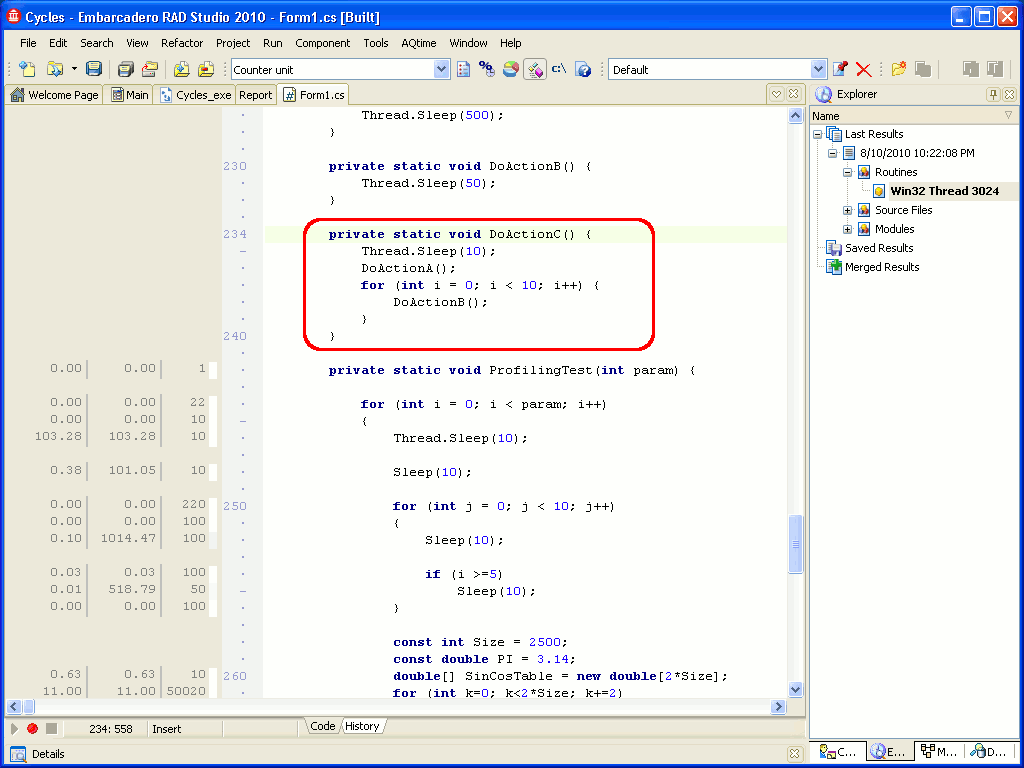
To look at the source code for DoActionC, click DoActionC in the Report panel and switch to the Editor panel click DoAction in the Report panel, select Show Source File from the Edit menu and switch to Visual Studio’s Code Editor double-click DoActionC in the Report panel and switch to Embarcadero RAD Studio’s Editor panel:
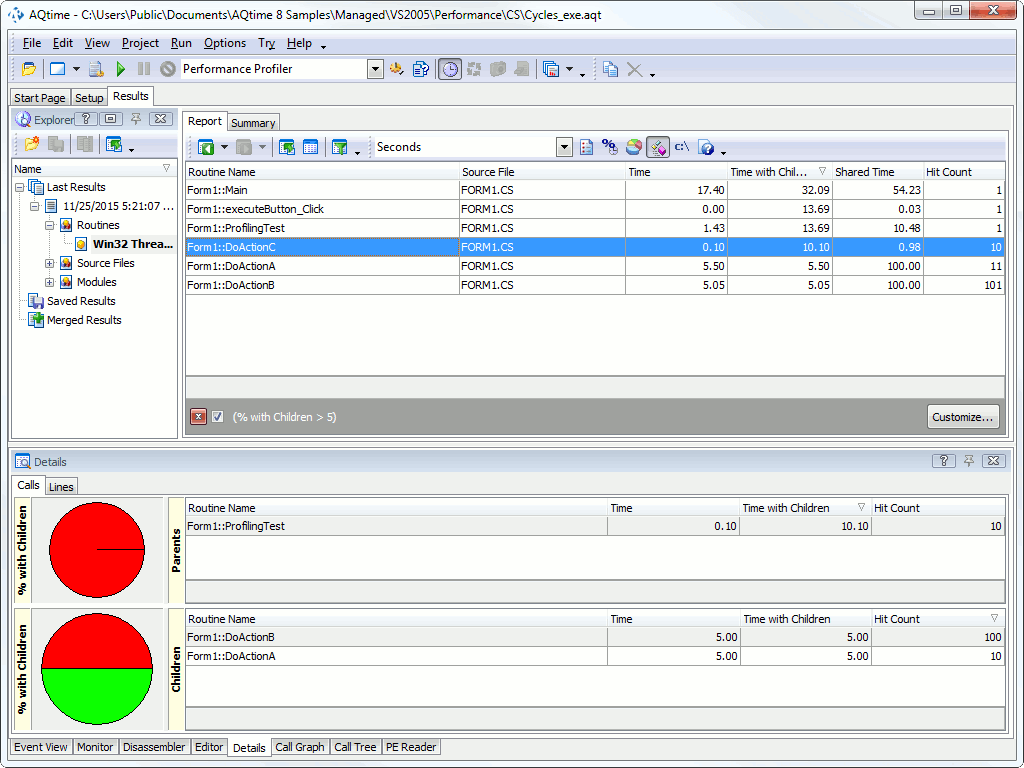
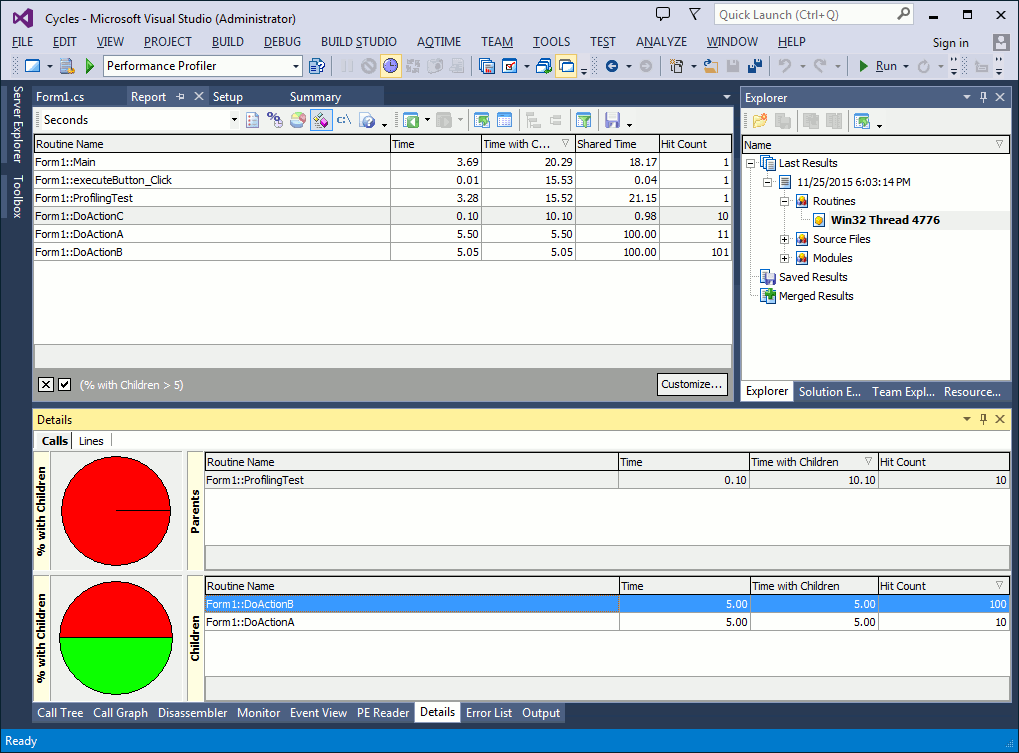
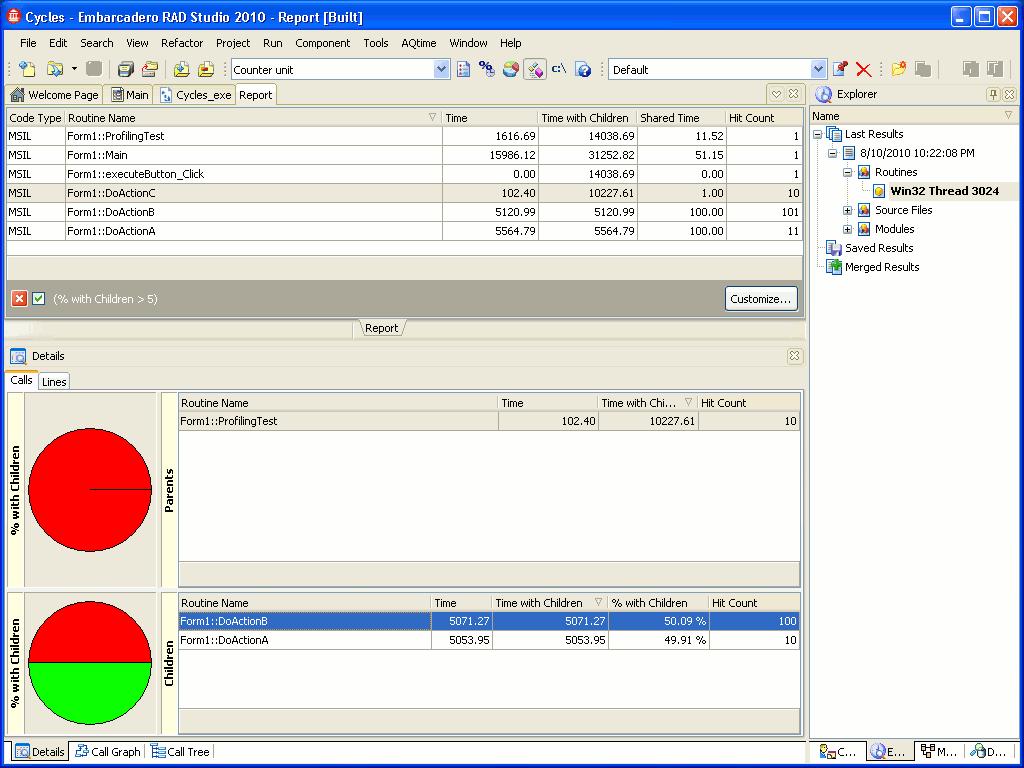
We can now review the problem source code. As expected, DoActionC does not perform any complex calculations. It simply calls two other routines: DoActionA and DoActionB. Let’s switch to the Calls page of the Details panel and look at the profiling results:
Now we know that the DoActionC routine has only been called from one point in the program (from the ProfilingTest parent routine). DoActionC has called two child routines - DoActionA and DoActionB, which are listed in the Children pane.
We also know that DoActionB has been called 101 times and it takes about 6.3 seconds (or 7.5% of the total execution time)6.3 seconds (or 7.5% of the total execution time)5.1 seconds (or 7.1% of the total execution time). DoActionA has been called 11 times and it takes about 5.5 seconds (or 6.6% of the total execution time)5.5 seconds (or 6.6% of the total execution time)5.5 seconds (or 7.7% of the total execution time).
To improve performance, a possible solution would be to decrease the number of calls to DoActionB or to increase the speed of DoActionA.
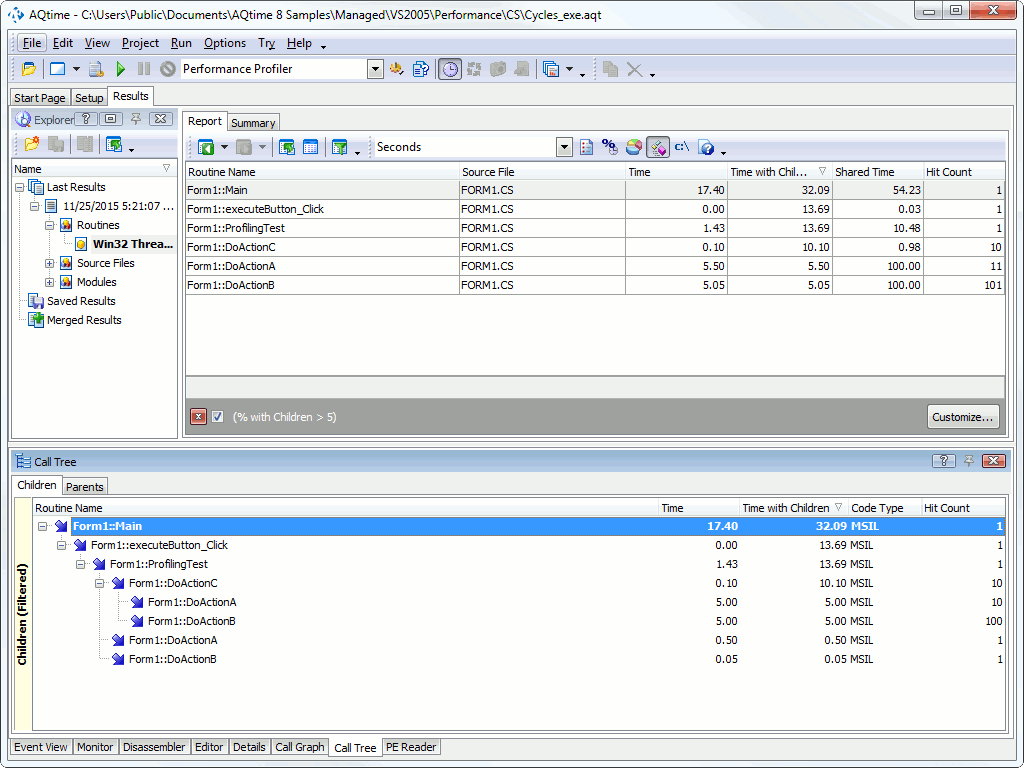
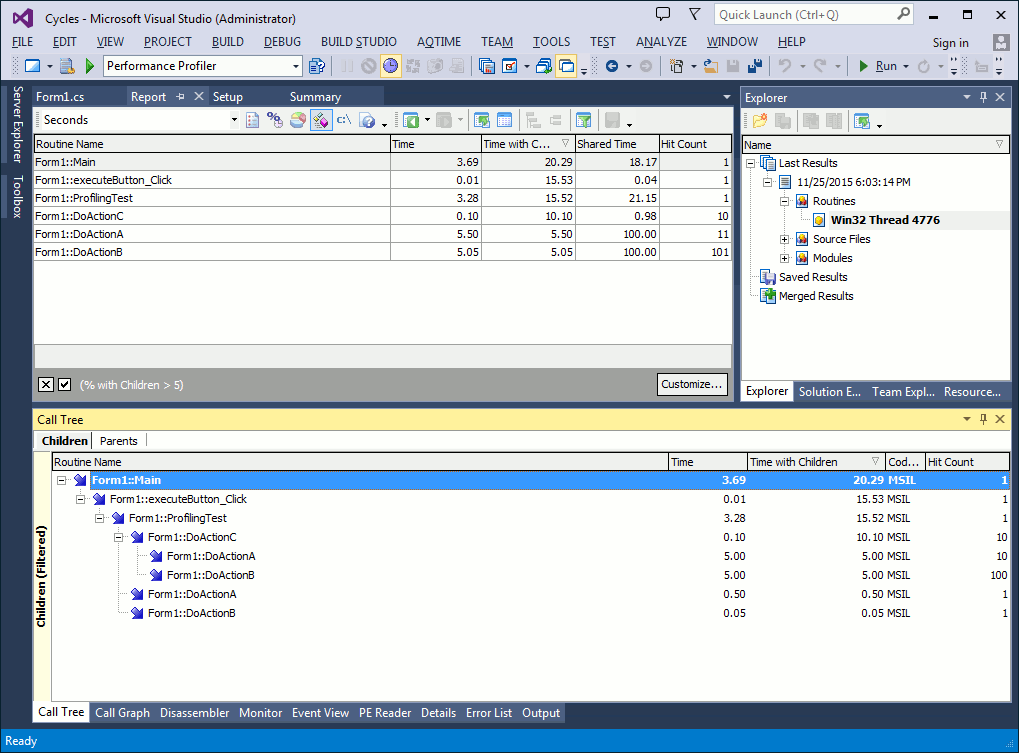
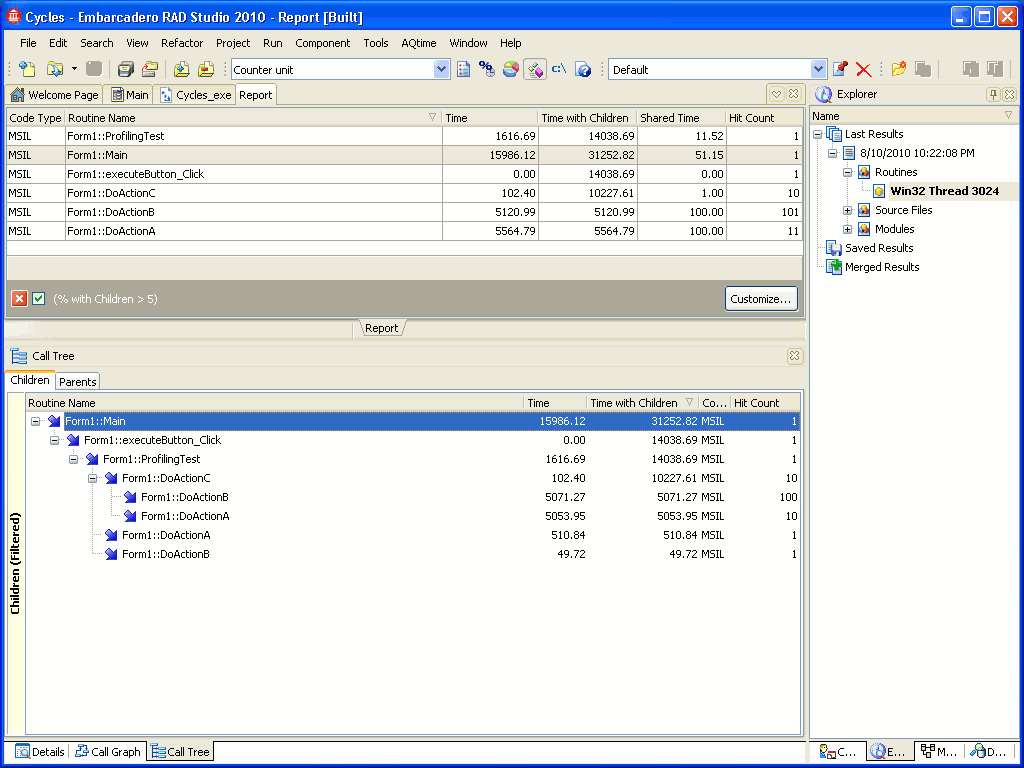
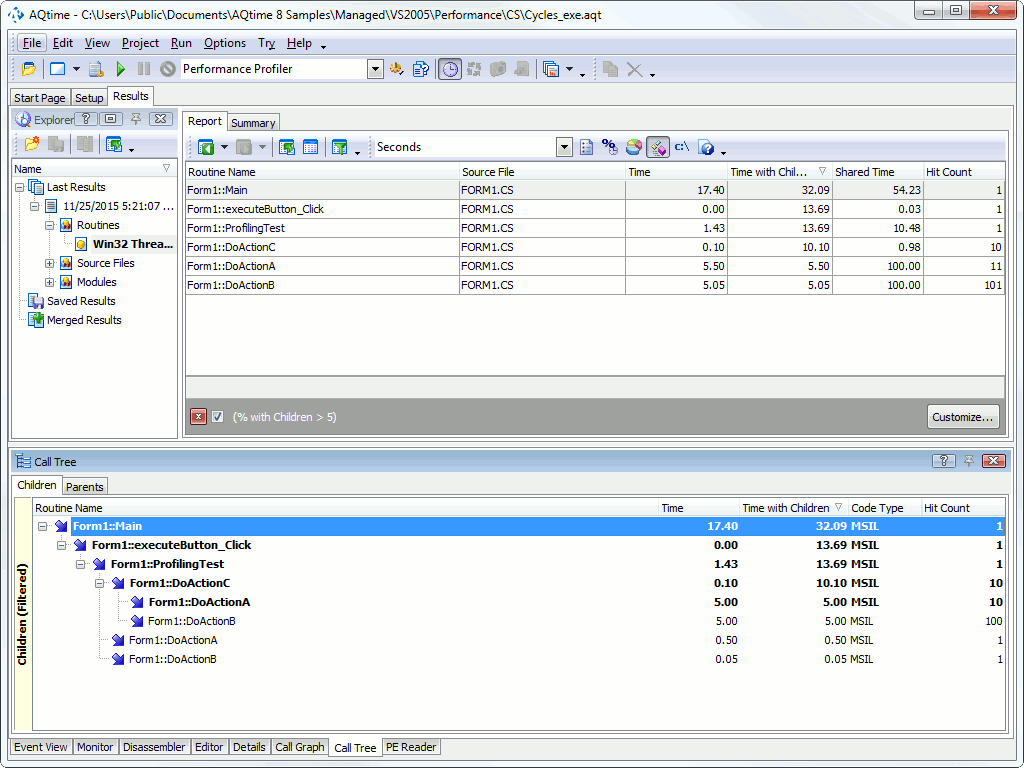
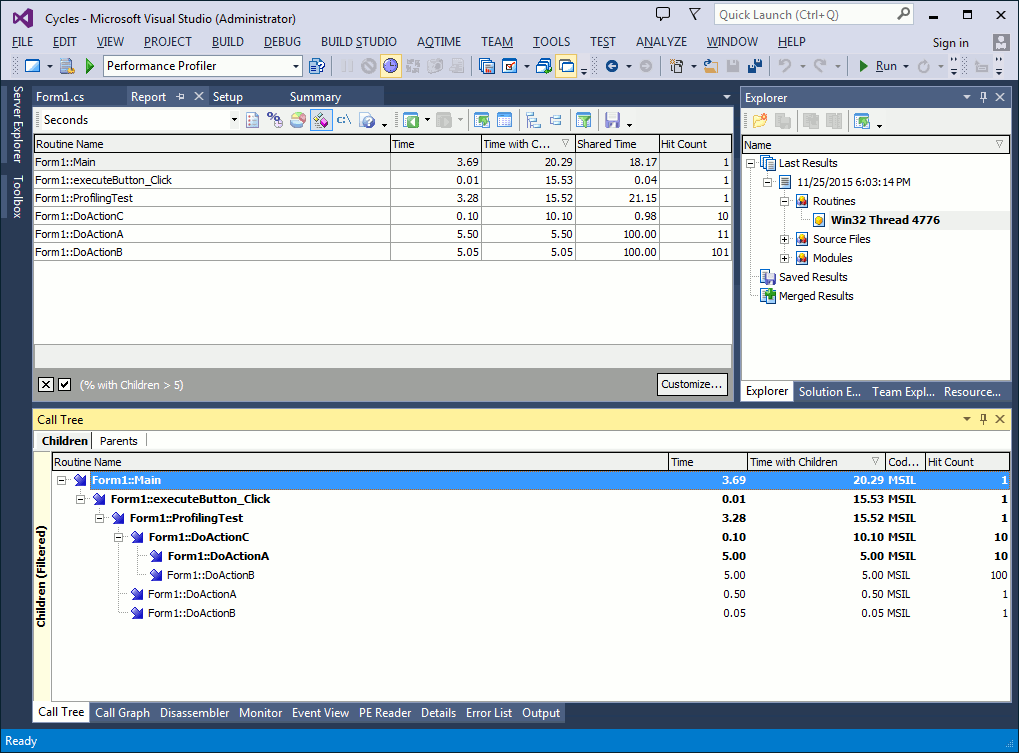
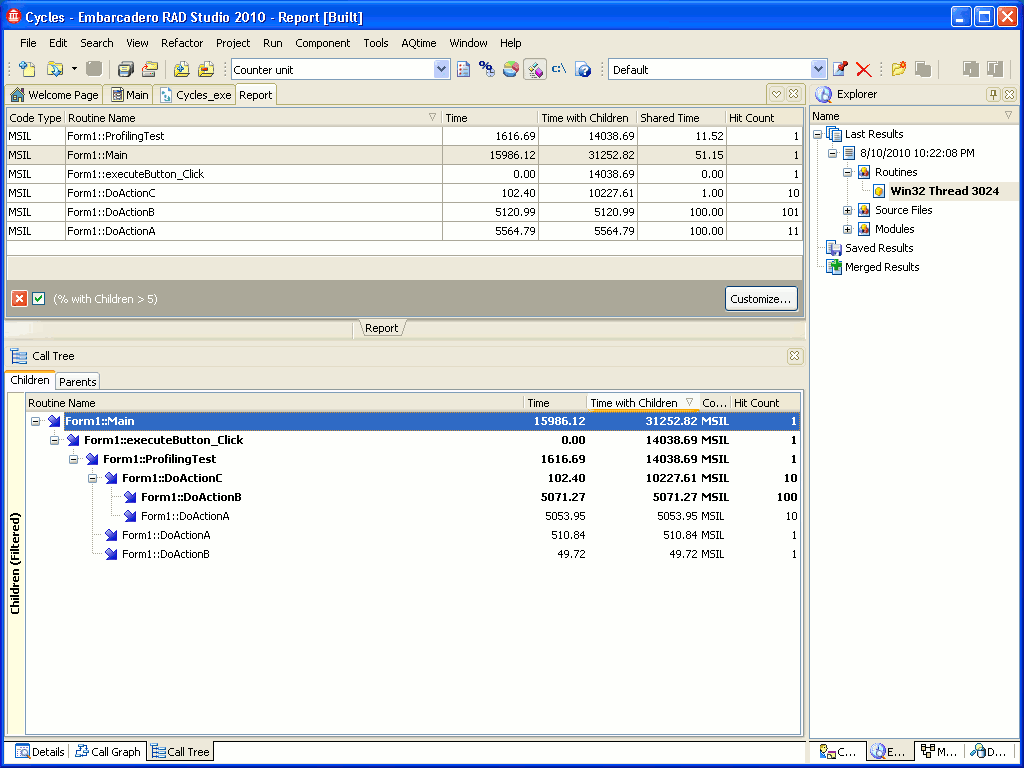
One more important characteristic of the application performance is the critical path. This is the longest route of routine calls in the entire application. To measure the "length", you can use values of any numeric column displayed in the Report panel. For instance, it can be useful to get the critical path calculated for the Time with Children column (total time spent on each routine’s execution including all its routine calls). To do this, click the Form1::Main routine in Report and switch to the Call Tree panel, whose Children pane displays the entire tree of routines called from Main. We have chosen this routine because it has no parents among the routines we profiled (in other implementations of our sample, there can be a different root routine). This gives us the complete call tree.
Select Customize from the context menu. This will call the Call Tree Options dialog. In the dialog, select the Show critical path for column check box and choose Time with Children in the dropdown list of columns. Press OK to close the dialog. Now we can see the critical path: this is the route displayed in bold.
Routines that belong to the critical path need optimizing since they seriously affect the overall performance of the application. As you can see, the critical path includes ProfilingTest, DoActionC and DoActionB, which we already detected as the routines that require optimization.
The Report and Details panels and the Editor’s gridthe Code Editor’s grid support custom summary fields, which can help you, say, to view the total time spent on executing all of the routines listed in Report. Also, if there are more than one record selected in any of these panels, the summary fields display information that corresponds to the selected records, rather than to all records.

 Prev
Prev