As we already mentioned, in addition to timing the execution of routines and source code lines, the Performance profiler can be used to count how many times each routine or source code line of the given routine has been executed (hit count) within a profile run.
The Hit Count column, which is displayed in the Report panel, indicates the number of calls to each function during the run. To sort routines by this value, click the Hit Count column header. Since we used neither triggers, nor actions during profiling, no one routine was excluded from profiling during the run. Therefore, Skip Count for all of the routines is zero.
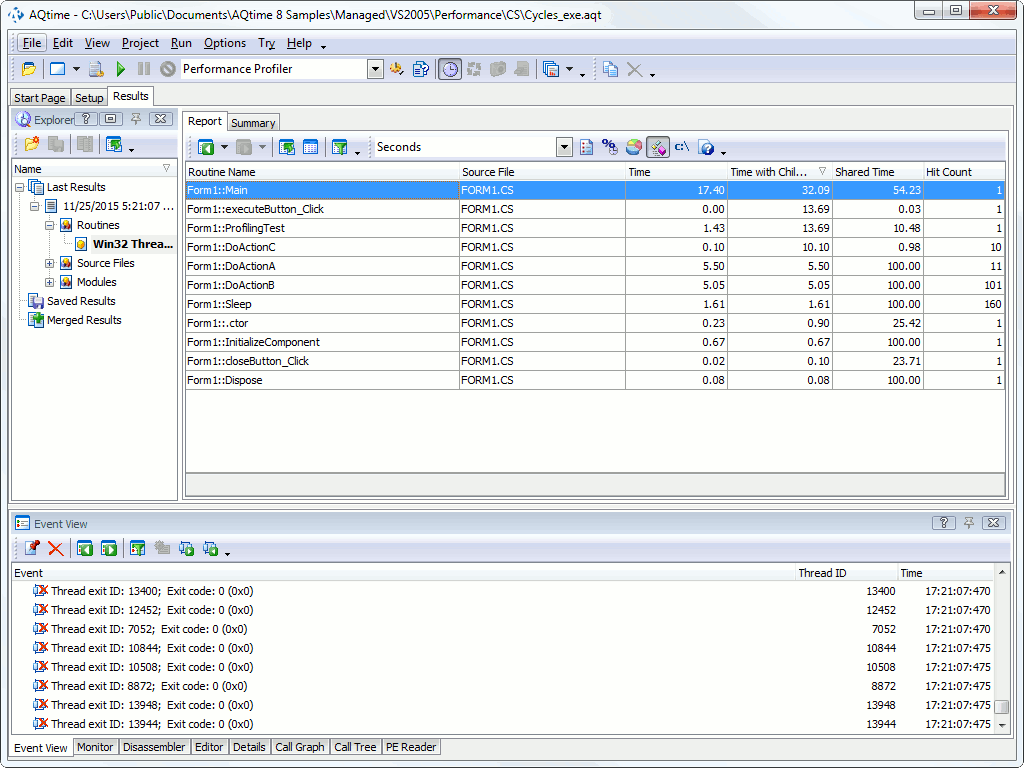
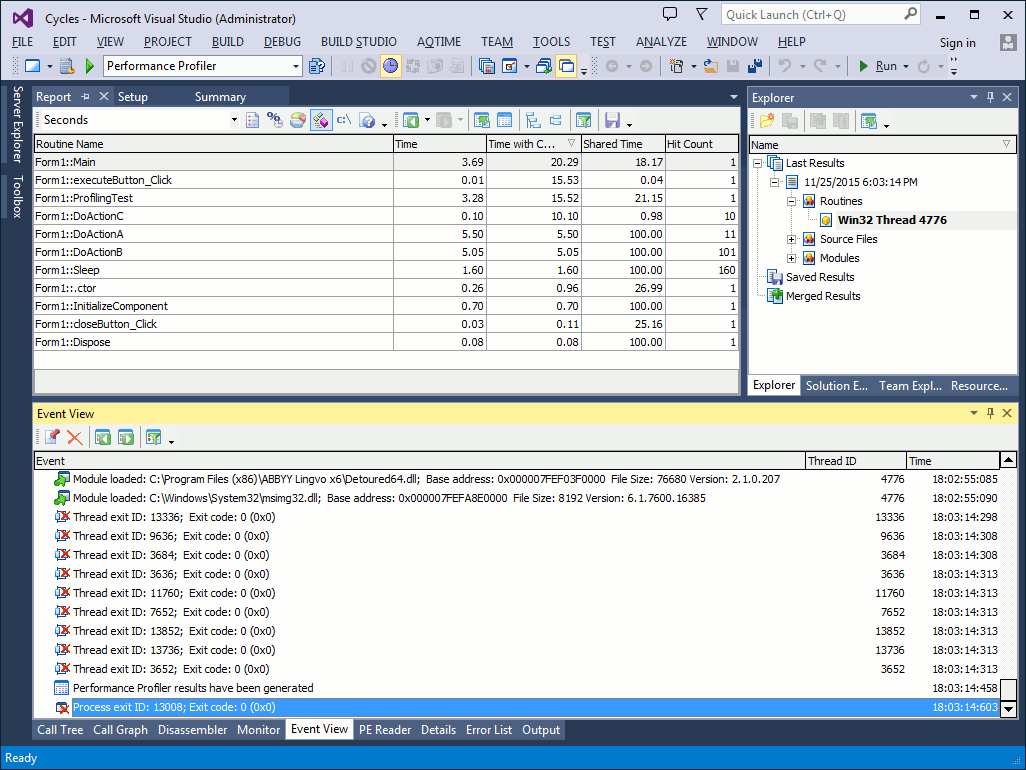
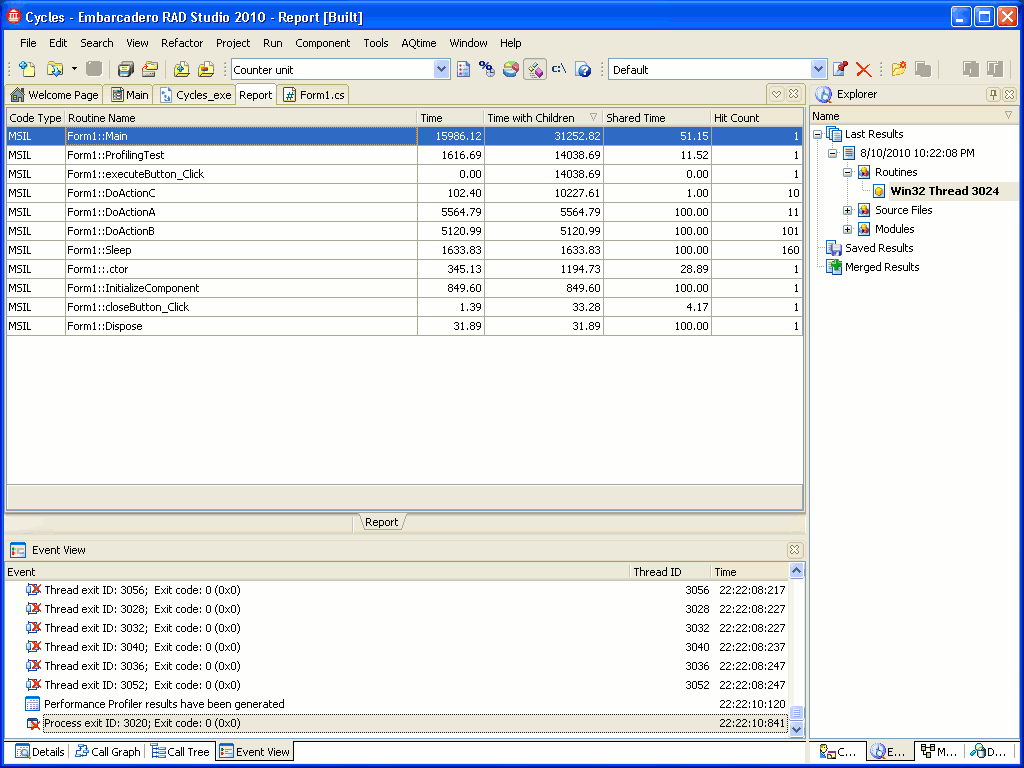
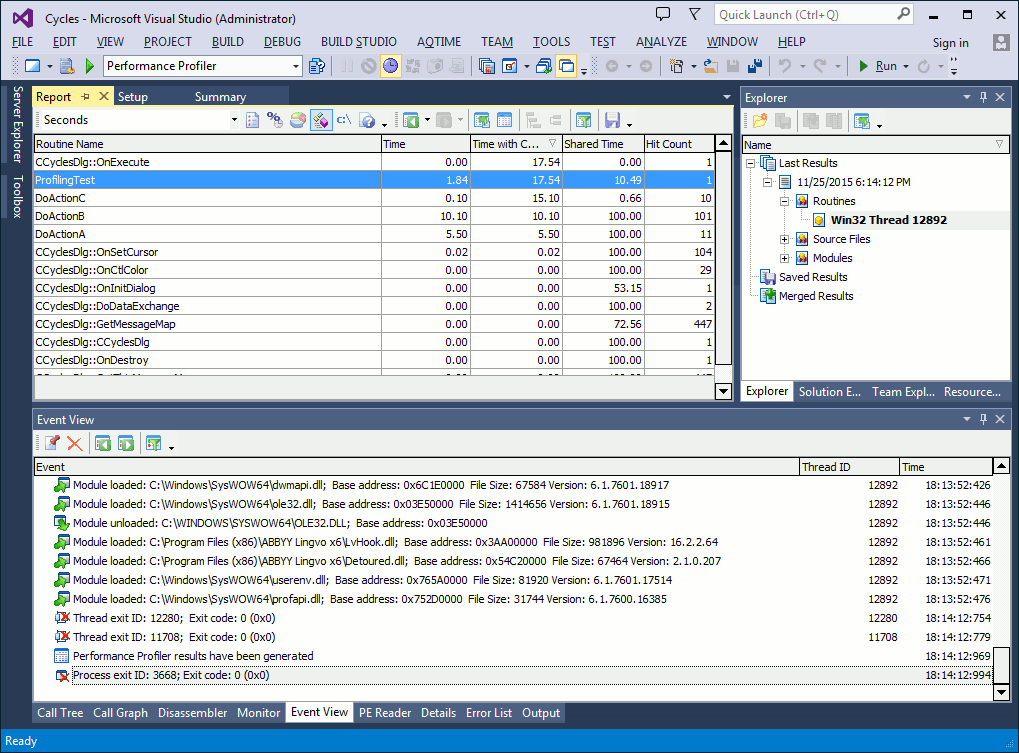
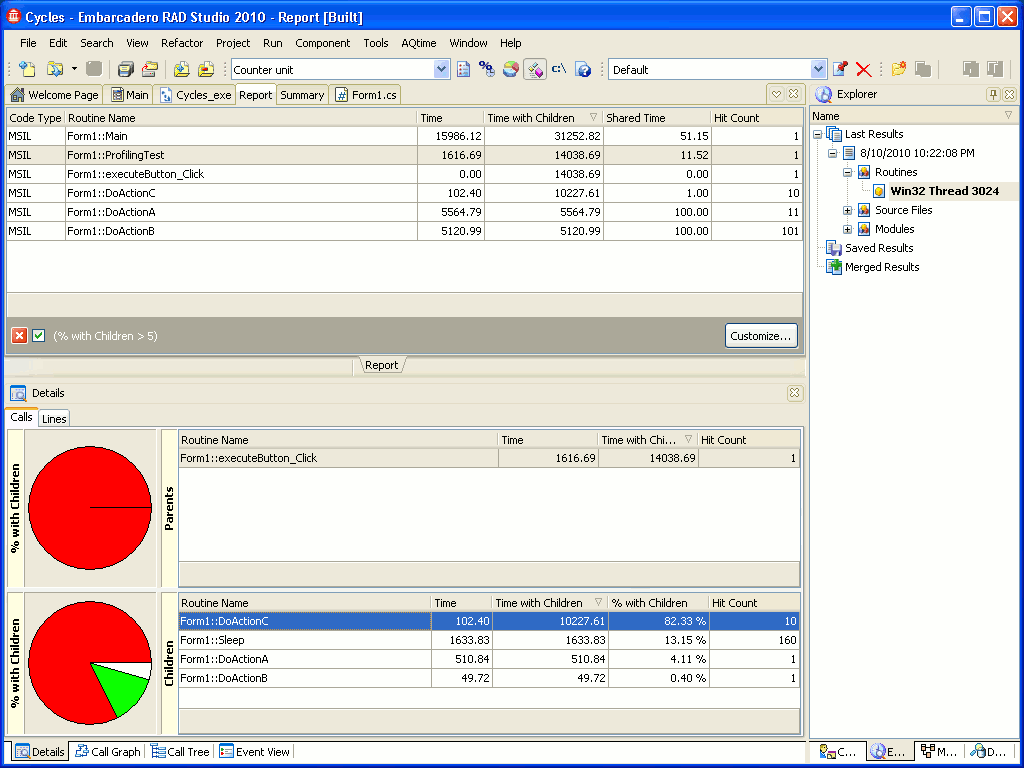
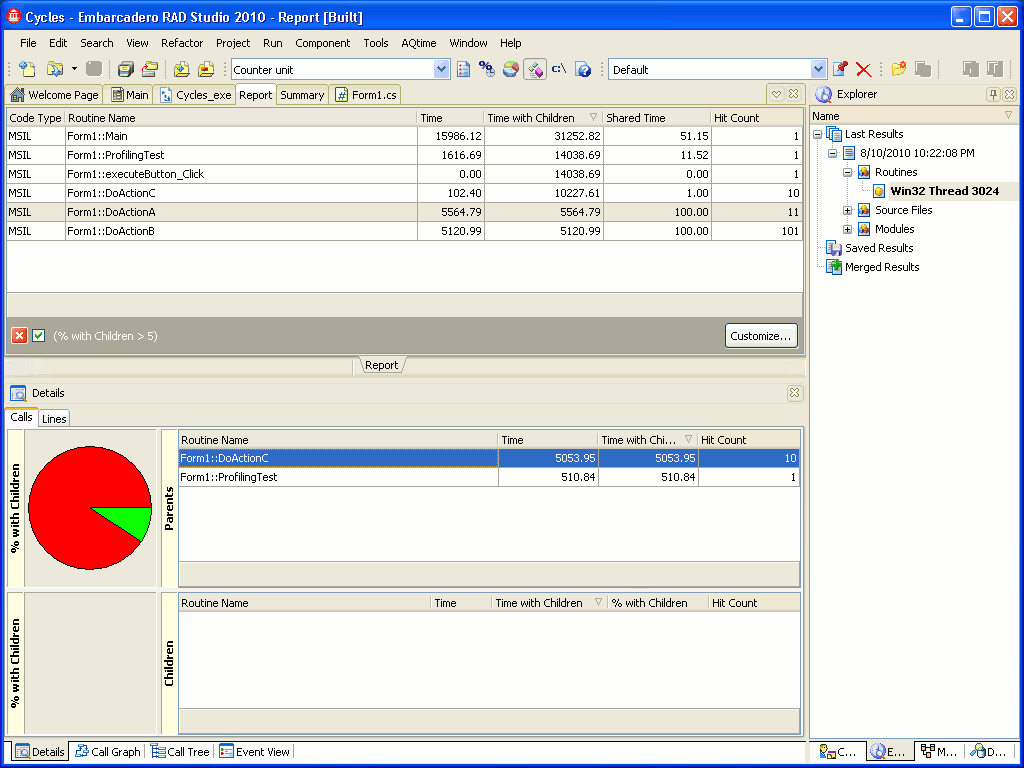
Again, let’s take a look at the profiling results we obtained for a managed implementation of the Cycles application:
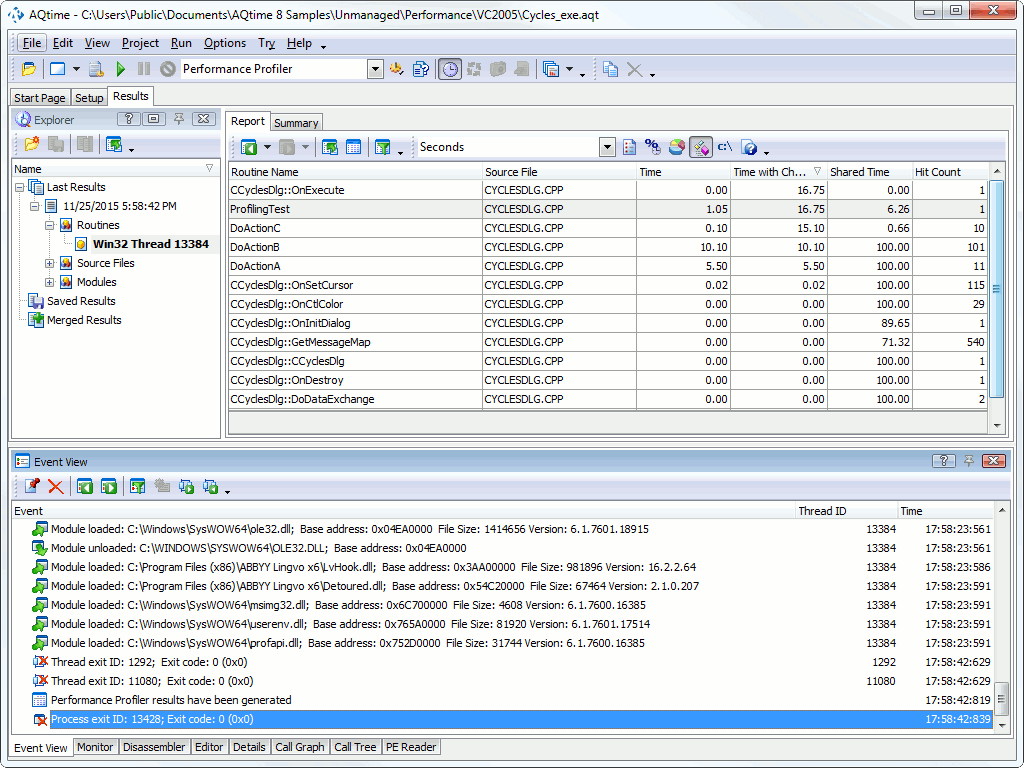
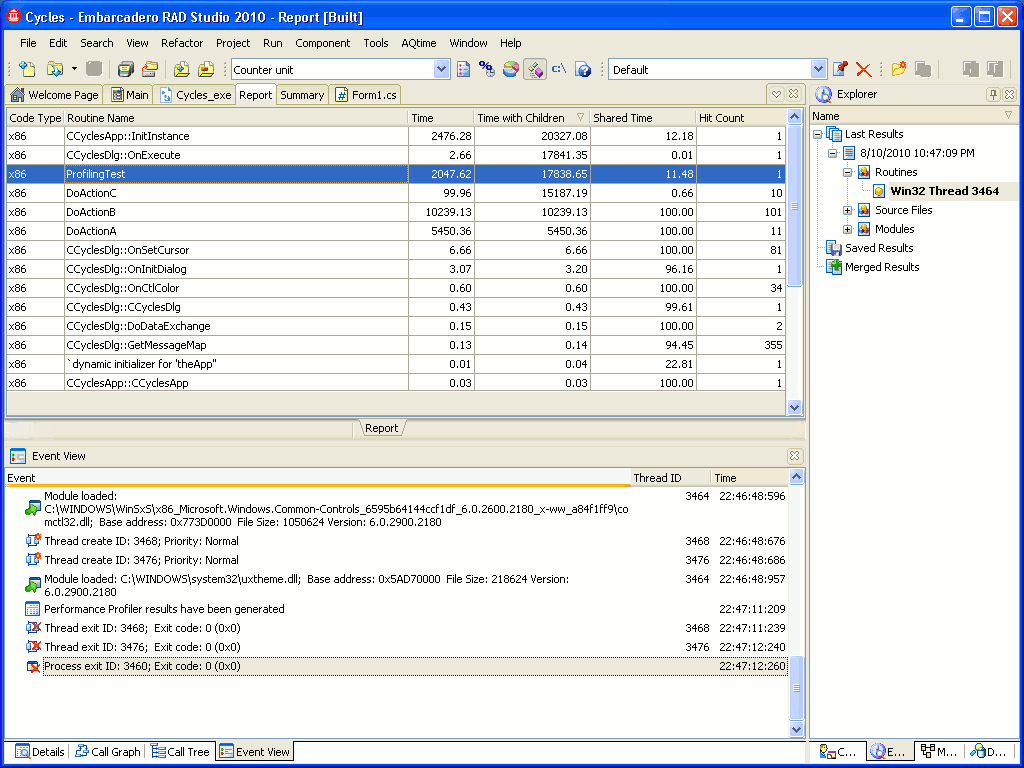
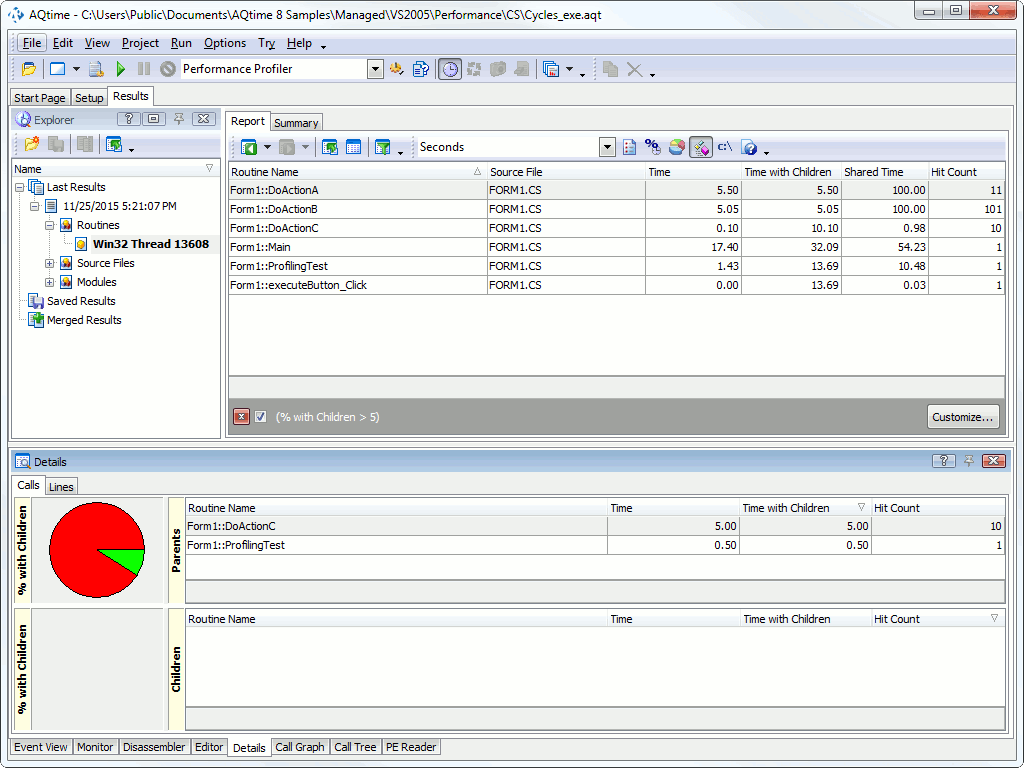
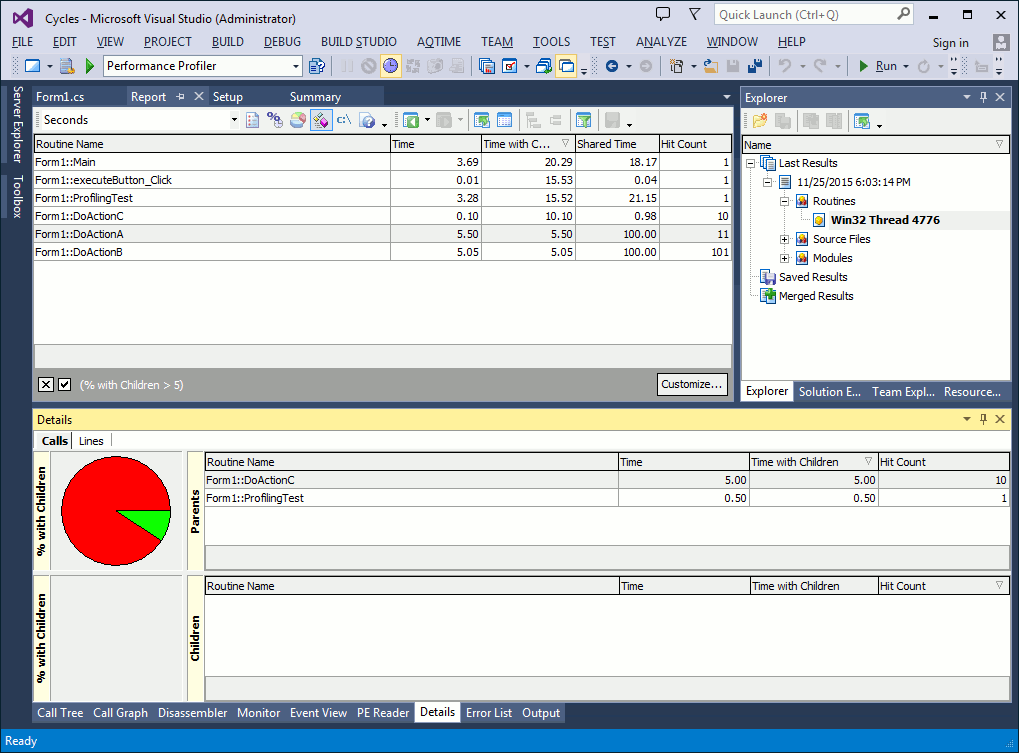
And for an unmanaged implementation of the sample:
In our test, if not to count Sleep and other auxiliary functions, the most frequently called routine is DoActionB. It has been called 101 times, DoActionA has been called 11 times, DoActionC - 10 times, and all other routines that interest us have been called only once, or have not been called at all (to display the routines that have not been called, press  Show non-hit routines on AQTime’s Profiler toolbar on the Profiler toolbar that is displayed within the Report panel on the Profiler toolbar that is displayed within the Report panel).
The EditorVisual Studio’s Code EditorEmbarcadero RAD Studio’s Editor panel and the Lines pane of the Details panel let you know the hit count of each source code line of a routine that was profiled at Line Level. As you already know, we profiled the ProfilingTest routine at Line Level, so we can view line hit count results for this routine if you select it in the Report panel.
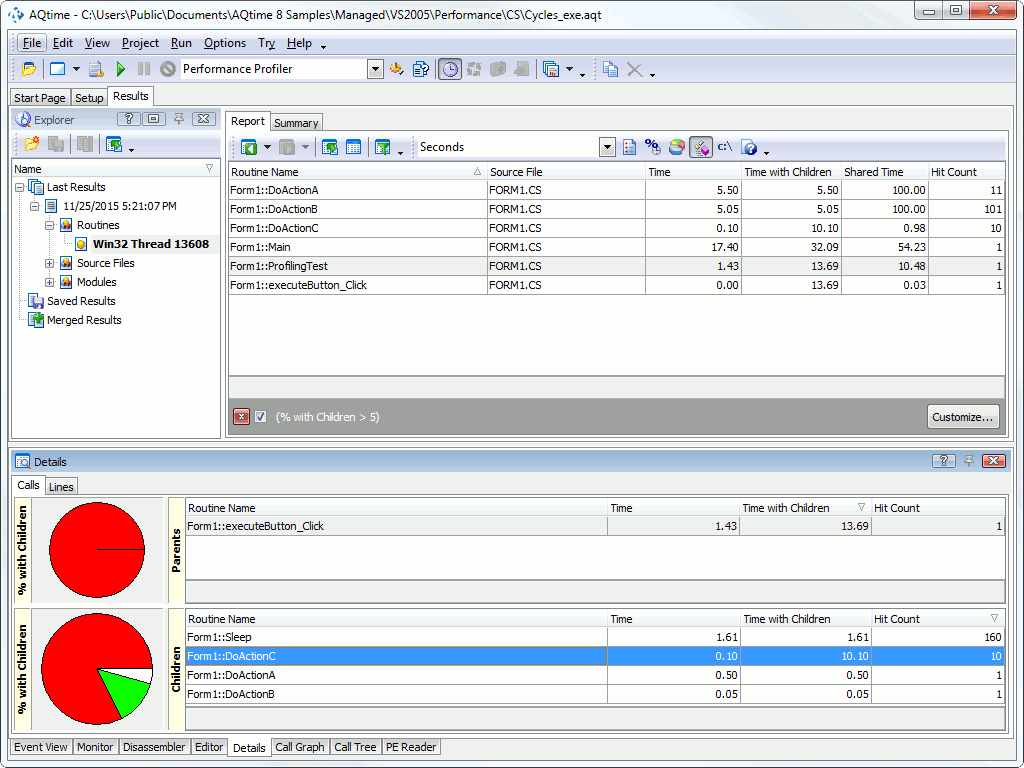
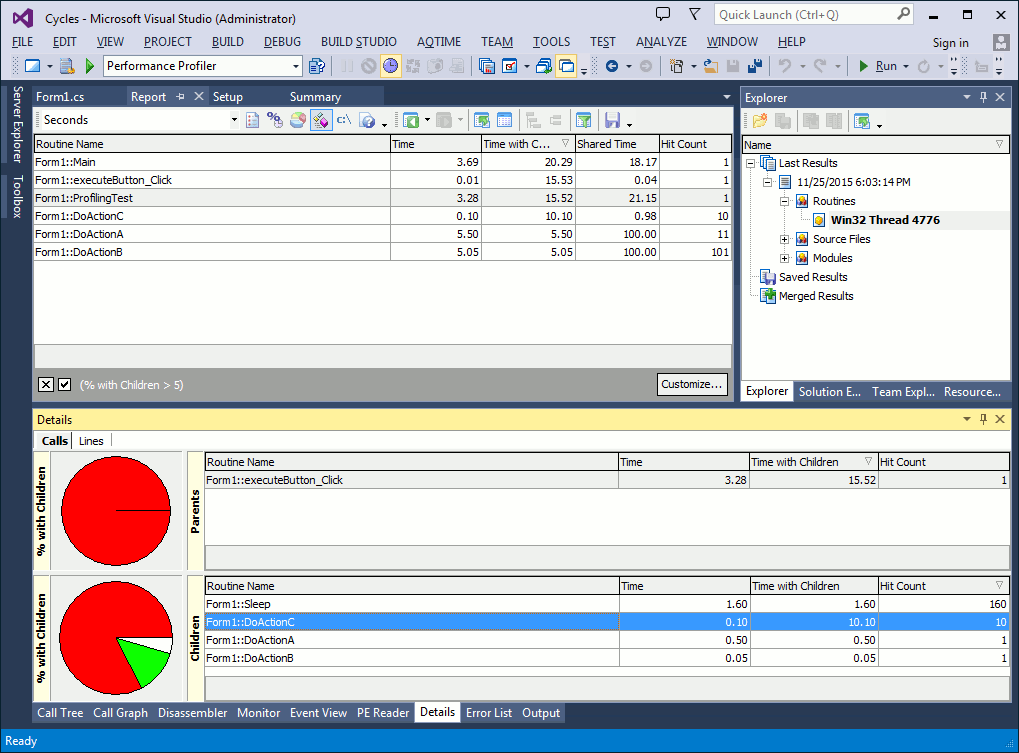
Let’s see what routines were called by ProfilingTest. Click on this routine in the Report panel and switch to the Children pane of Details. No matter which implementation of the sample we are using, we will get similar results. For instance, for the C# version, the results will looks as follows:
You will see that ProfilingTest called DoActionC ten times, DoActionB one time and DoActionA once as well. Recall that the Report panel told us that DoActionA was executed 11 times and DoActionB - 101 times. Therefore, DoActionA was called 1 time from the ProfilingTest routine and 10 times from somewhere else in the code, DoActionB was called 1 time from the ProfilingTest routine and 100 times from somewhere else in the code.
To find where this occurred, simply double-click DoActionA in the Details panel. Now you can see (in the Parents pane) that it was DoActionC that called DoActionA the other ten times. If you double-click DoActionB in the Details panel, the Parents pane will show you that it was DoActionC again that called DoActionB the other 100 times.

 Prev
Prev