We tested the COM server in the single-client configuration. Now let’s profile the server when several clients are connected to it. We will use the Performance profiler again.
-
Set the Thread model option of this profiler to COM Threads (it is also available in several other profilers. See Profiling COM Logical Threads). Later you will see why this is necessary.
Now follow these steps:
- Press
 Run on the Standard toolbar.Select
  Run from Visual Studio’s AQTime menu, or press Visual Studio’s
  Run button while any of AQTime
panels is active.Select Run With Profiling from Embarcadero RAD Studio’s AQTime menu.
 - Once the first client application is started, run another client application (they can be compiled with different compilers) or the second instance of the same client application, and press Connect in each of them. Establishing the first connection will launch the server application.
- Now like in the previous test you can perform actions on the clients and watch how they affect the server and vice versa.
- Besides the actions you wish to try on the clients and on the server, do the following:
- On the first client, press Show Info but on the server do not close the dialog this calls.
- On the second client, press Select to change the color of the shape on the server.
- On the server, close the dialog.
- On each client, press Disconnect and close the client. Upon disconnecting the last client the server will be closed automatically and then AQTime will generate profiling results.
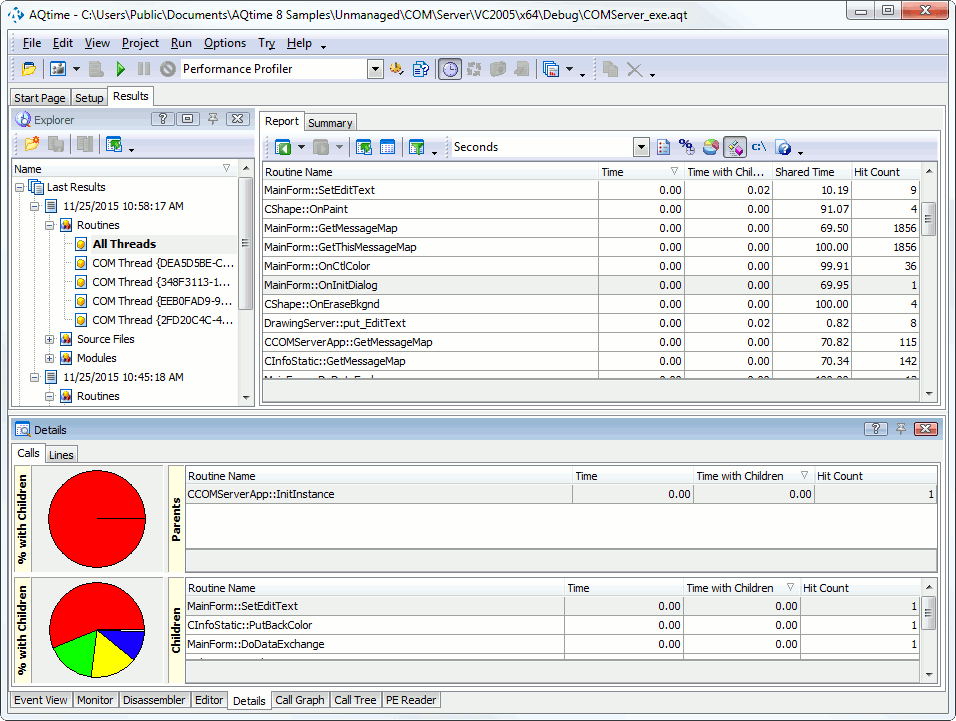
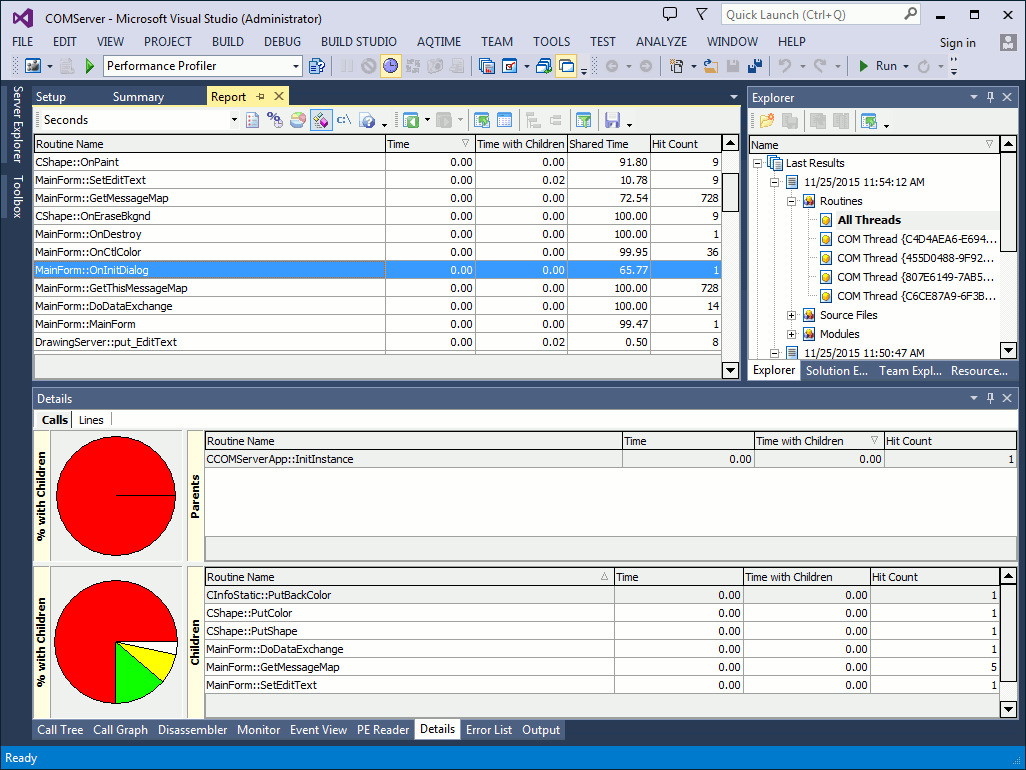
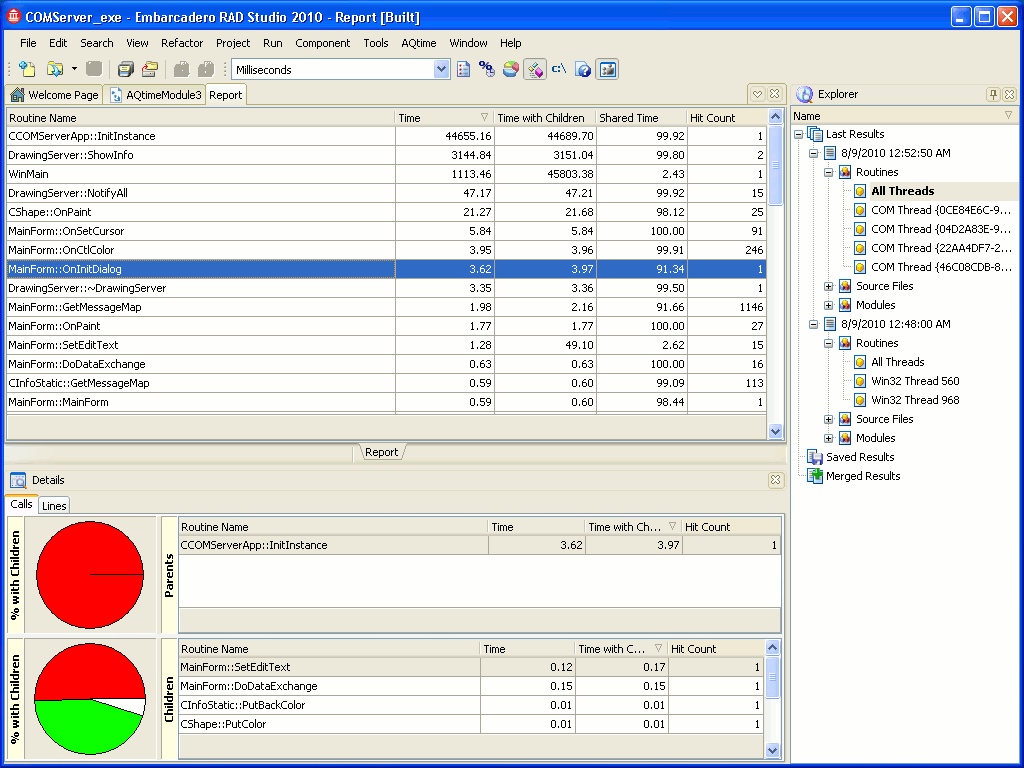
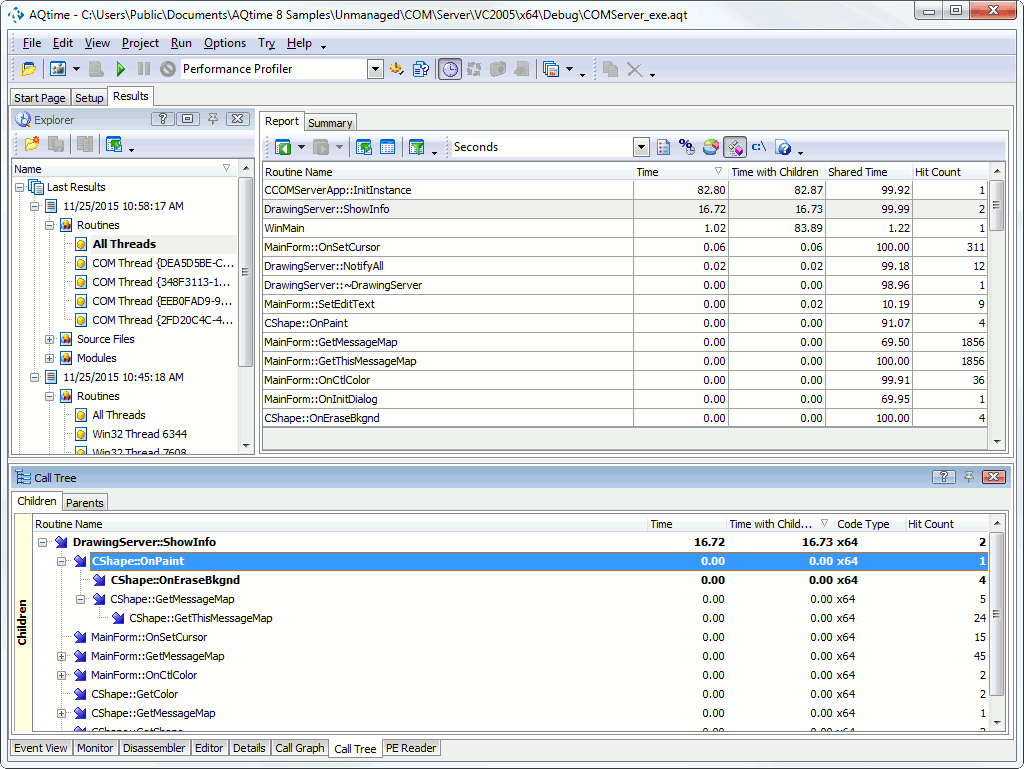
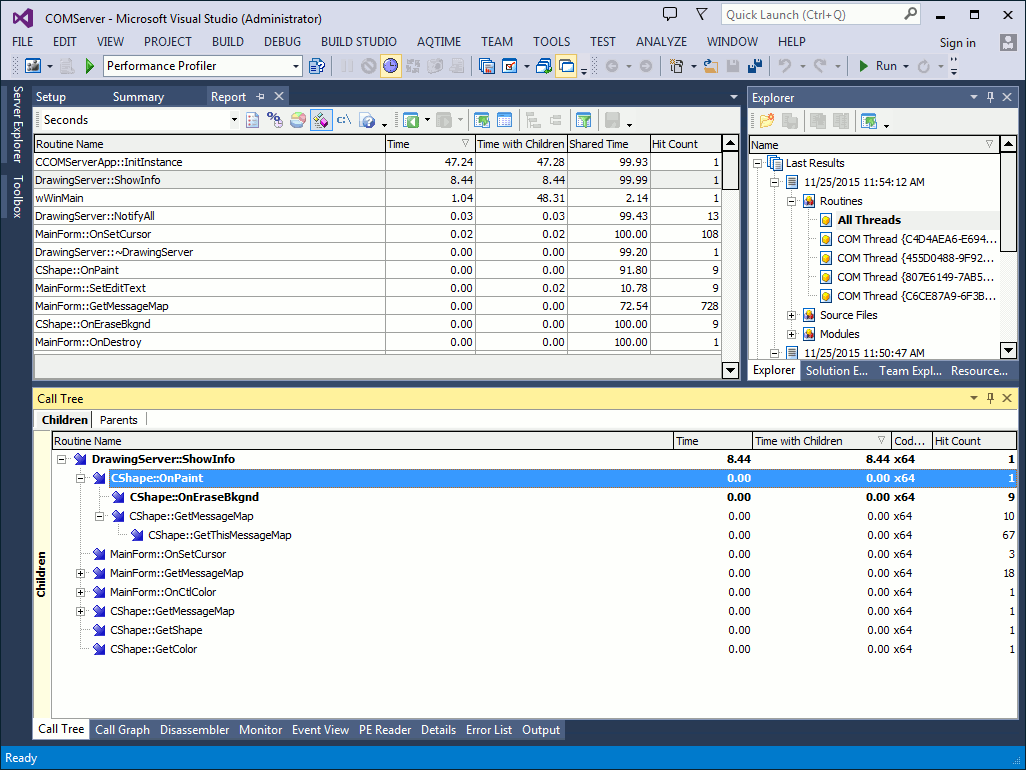
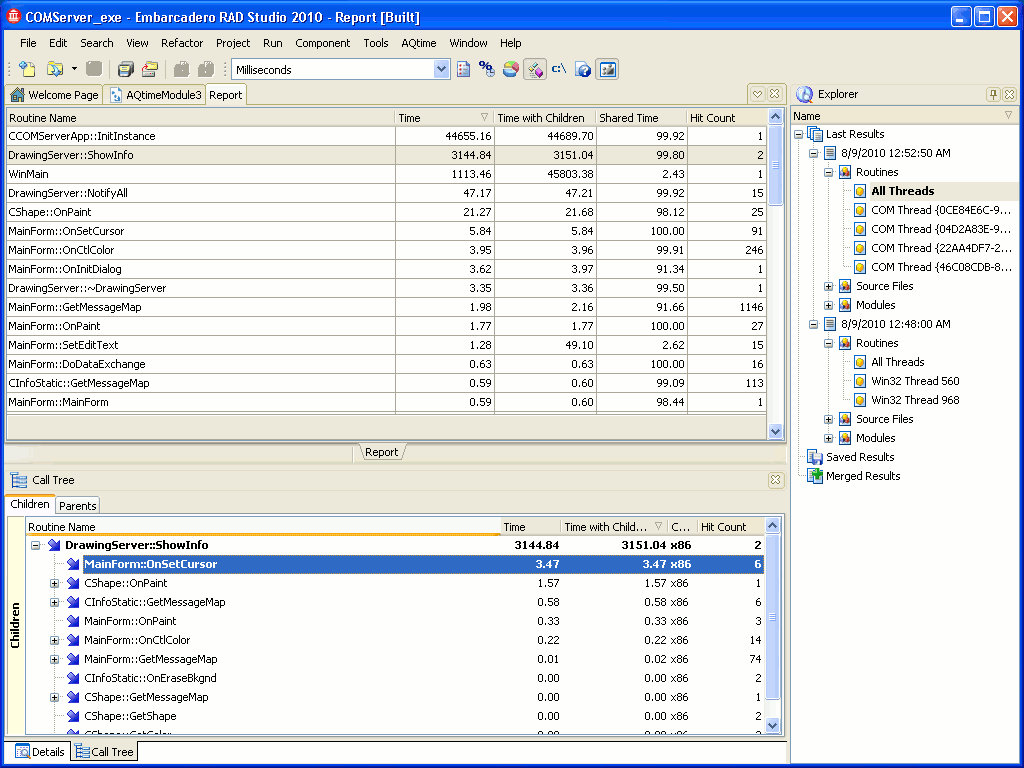
As you can see, results are now separated into four treads. They are actually logical threads, which are confirmed by the fact that they all have the same thread ID. Thread #1 is the thread of the main form of the server application. Thread #2 is an auxiliary thread that may appear in some implementations of our server application (for instance, for Visual C++). Processing the requests from each client is displayed as a separate thread (Thread #3 and Thread #4).
When you pressed the Show Info button on one of the clients, this called the ShowInfo routine on the server. When you changed the shape color from another client, this called the put_ShapeColor (Visual C++) or Set_ShapeColor (Delphi) routine on the server. If you double-click any of these routines (ShowInfo or put_ShapeColor (Set_ShapeColor)) in Report, and switch to the Call Tree or Call Graph panel, you will see that they are not parents or children of each other, which is true.
Now let’s set the Thread model option to Win32 Threads and perform the same operations with the server and two clients to see what we get in the profiling results.
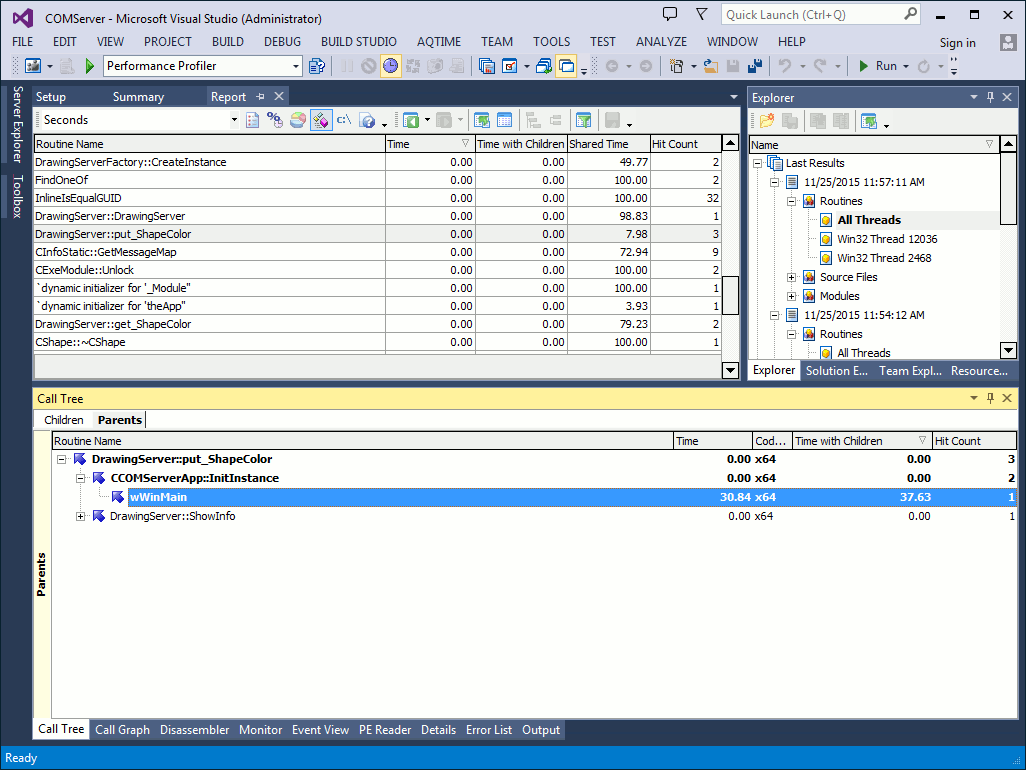
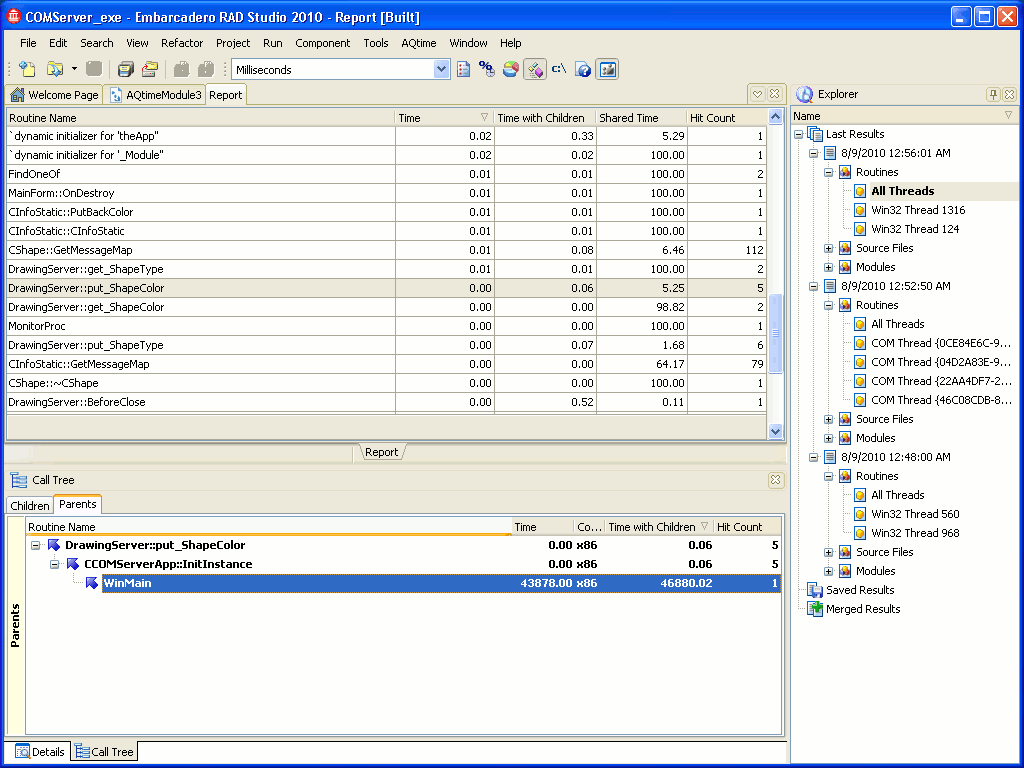
Select the put_ShapeColor (Set_ShapeColor) routine in the Report panel and switch to the Call Graph or Call Tree panel. Now you are told that put_ShapeColor (Set_ShapeColor) is a child of the ShowInfo routine on the server. This is not true because it is impossible.
To confirm this, you can either take a look at the code of ShowInfo in the Editor panelin Visual Studio’s Code Editorin Embarcadero RAD Studio’s Editor to make sure there are no calls to Set_ShapeColor (put_ShapeColor) or you can use AQTime’s Static Analysis profiler. Let’s choose the second variant:
- Select Static Analysis from the Profilers dropdown list on the Standard toolbar.Select Static Analysis from the Profilers dropdown list displayed in the AQTime menu of Microsoft Visual Studio.Select Static Analysis from the Current Profiler submenu displayed in the AQTime menu of Embarcadero RAD Studio.
- Press
 Run on the Standard toolbar.Select
  Run from Visual Studio’s AQTime menu.Select Run With Profiling from Embarcadero RAD Studio’s AQTime menu.
 - Upon getting the profiling results, select the
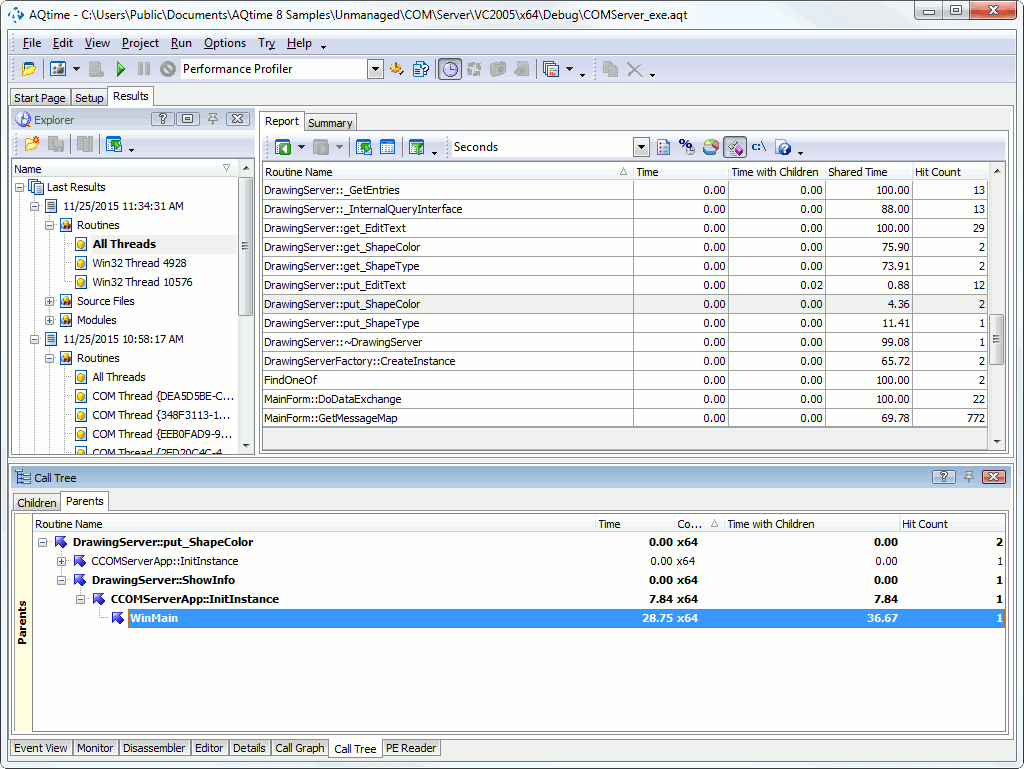
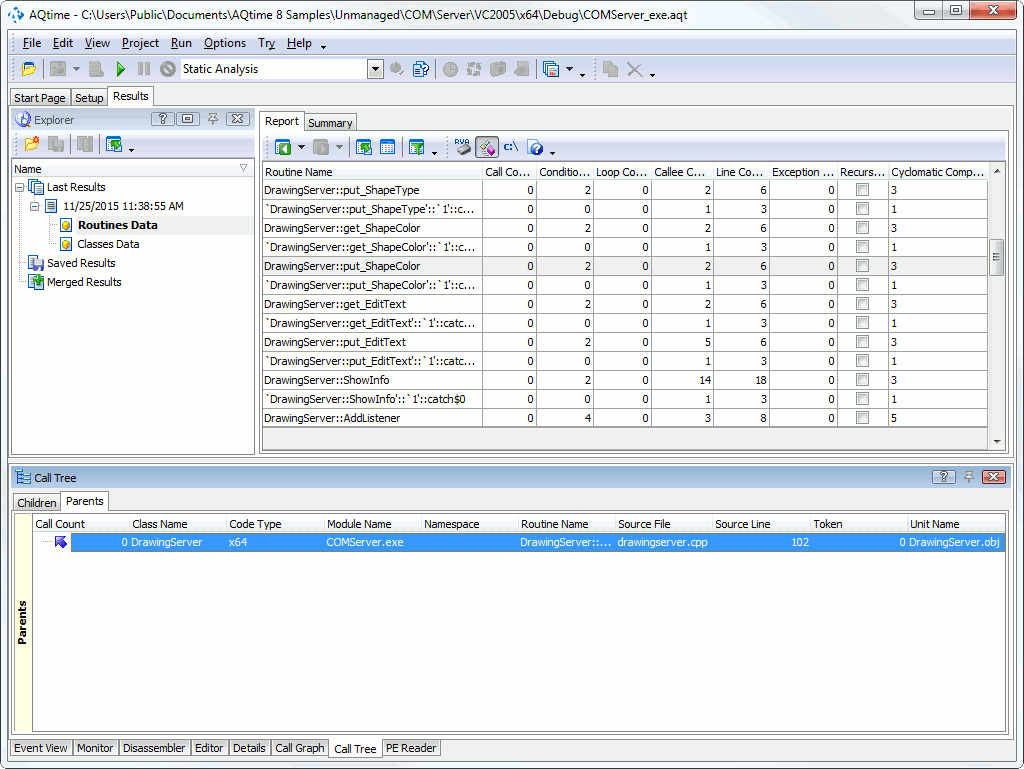
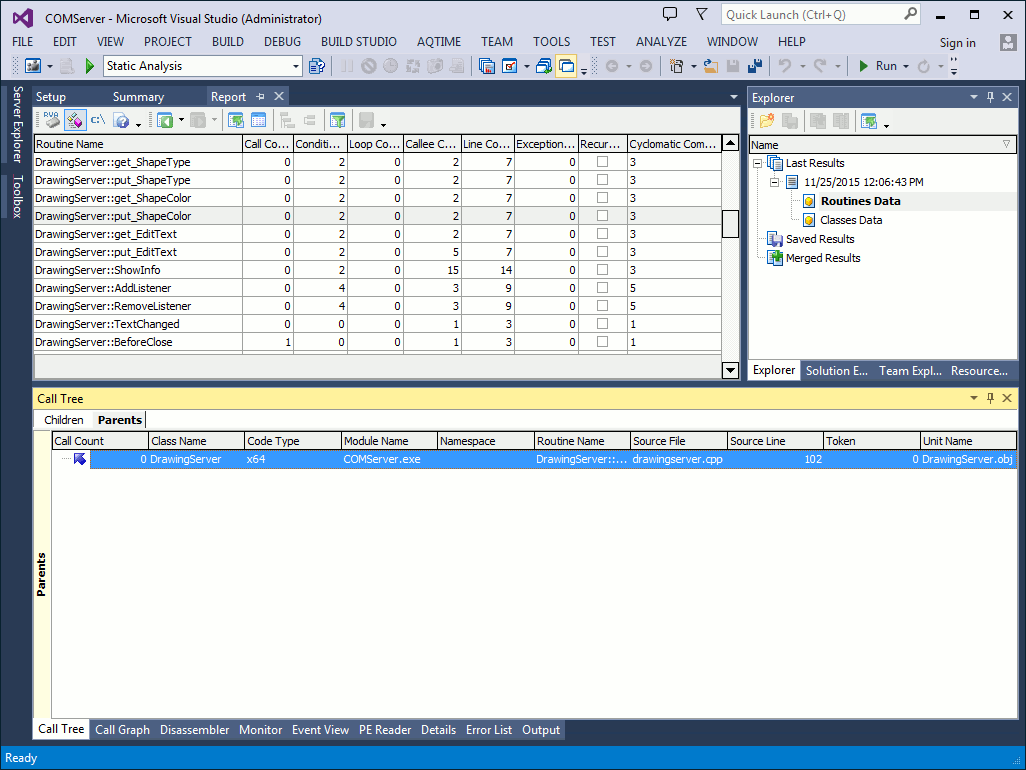
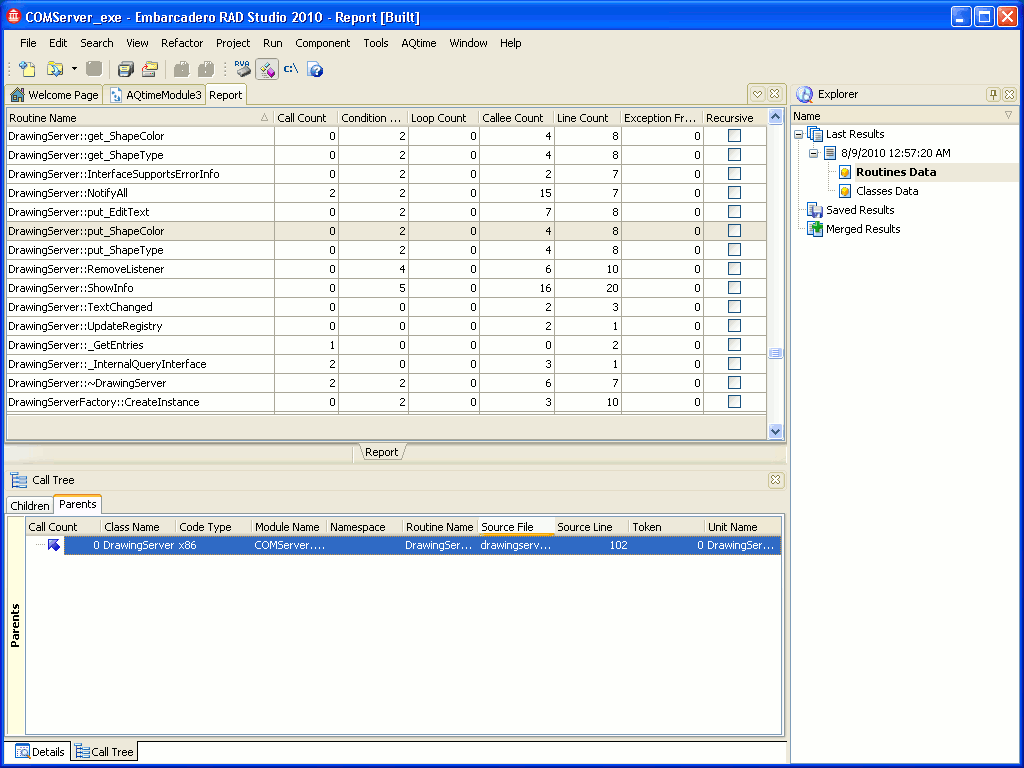
put_ShapeColor(Set_ShapeColor) routine in the Report panel and switch to the Call Graph or Call Tree panel. Now you can see for sure that this routine does not haveShowInfoamong its potential callers on the server, soShowInfocould not callput_ShapeColor(Set_ShapeColor) and the last results of the Performance profiler are incorrect.
This can happen in the profiling results because AQTime considers all of the calls from different clients as if they were made from the same client. To avoid this, follow the rule: whenever you use multi-client connections to the server, set the Thread model option to COM Threads, otherwise you will get incorrect profiling results concerning parent-child relationships.

 Prev
Prev