
To illustrate how to profile COM applications, we will use a sample out-of-process COM server application that is supplied with AQTime (COMServer).
 |
On Windows Vista and later, AQTime samples are located in the <Users>\Public\Documents\AQTime 8 Samples folder. On other operating systems, the samples reside in the <Documents and Settings>\All Users\Documents\AQTime 8 Samples folder. |
| Note: | The items below specify the IDE versions in which sample projects were created. You can open these projects in later versions of the needed IDE. |
Server applications
 <AQTime Samples>\Unmanaged\COM\Server\RAD_XE - Embarcadero RAD Studio XE
<AQTime Samples>\Unmanaged\COM\Server\VB - Microsoft Visual Basic 6.0
<AQTime Samples>\Unmanaged\COM\Server\VC2013 - Microsoft Visual C++ (Visual Studio 2013 project)
<AQTime Samples>\Unmanaged\COM\Server\VC2005 - Microsoft Visual C++ (Visual Studio 2005 project)
<AQTime Samples>\Unmanaged\COM\Server\BCB - Borland C++Builder
<AQTime Samples>\Unmanaged\COM\Server\Delphi - Borland Delphi
Also, AQTime includes the COM client application for the server (COMClient):
Client applications
<AQTime Samples>\Unmanaged\COM\Client\RAD_XE - Embarcadero RAD Studio XE
<AQTime Samples>\Unmanaged\COM\Client\VB - Microsoft Visual Basic 6.0
<AQTime Samples>\Unmanaged\COM\Client\VC2013 - Microsoft Visual C++ (Visual Studio 2013 project)
<AQTime Samples>\Unmanaged\COM\Client\VC2005 - Microsoft Visual C++ (Visual Studio 2005 project)
<AQTime Samples>\Unmanaged\COM\Client\BCB - Borland C++Builder
<AQTime Samples>\Unmanaged\COM\Client\Delphi - Borland Delphi
Make sure the COM server for your compiler is registered in the operating system. The easiest way to do this is to run the corresponding server executable and specify the /RegServer key in its command line.
After you registered the server, you can start profiling the server application:
-
Open the server application for your compiler in AQTime as a separate project. For instance, let’s take the Visual C++ version of our sample that is compiled in Visual Studio 2005.
-
Select Performance Profiler from the Profilers drop-down list on the Standard toolbar.Select Performance Profiler from the Profilers drop-down list displayed in the AQTime menu of Microsoft Visual Studio.Select Performance Profiler from the Current Profiler submenu displayed in the AQTime menu of Embarcadero RAD Studio.
-
Enable All Project Modules (Routines only) and disable Entire .NET Code in the Setup panel. (Review About Areas for the details of defining areas and selecting the code to profile.)
-
You can use either COM or Normal profiling mode. In COM mode, a COM server runs when a client connects to it and closes when there are no more client connections. In Normal mode, AQTime runs a COM server even if there are no client connections to it and you must close the server manually when you wish to finish profiling. We will use COM mode since unlike Normal mode it allows profiling the server’s initialization: select
 COM from the Profiling Mode drop-down list box that is displayed on AQTime’s Standard toolbarselect COM from the Profiling Mode drop-down list box that is displayed on Visual Studio’s AQTime toolbarclick the COM button on RAD Studio’s AQTime Profiling Modes toolbar(
 Normal is selected there by default).
 -
Verify that the
 Enable/Disable Profiling item on the Standard toolbarin the AQTime menu of Visual Studioin the AQTime menu of RAD Studio is pressed since AQTime only profiles when this button is pressed.
 -
Select Run > Parameters from AQTime’s main menu.Select Parameters from Visual Studio’s AQTime menu.Select AQTime > Parameters from Embarcadero RAD Studio’s main menu.
-
In the resulting Run Parameters dialog, specify the location of the client application you want to run (the client and server can be compiled with different compilers).
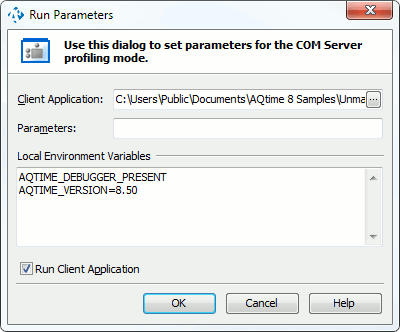
If you do not set the client application, when starting profiling AQTime will display a message box informing you that you should run a client application that uses the server.
-
Make sure to enable the Run Client Application check box. Press OK to close the Run Parameters dialog.
-
Press
 Run on the Standard toolbar.Select Run from Visual Studio’s AQTime menu, or press Visual Studio’s
  Run button while any of AQTime
panels is active.Select Run With Profiling from Embarcadero RAD Studio’s AQTime menu.
Run button while any of AQTime
panels is active.Select Run With Profiling from Embarcadero RAD Studio’s AQTime menu. -
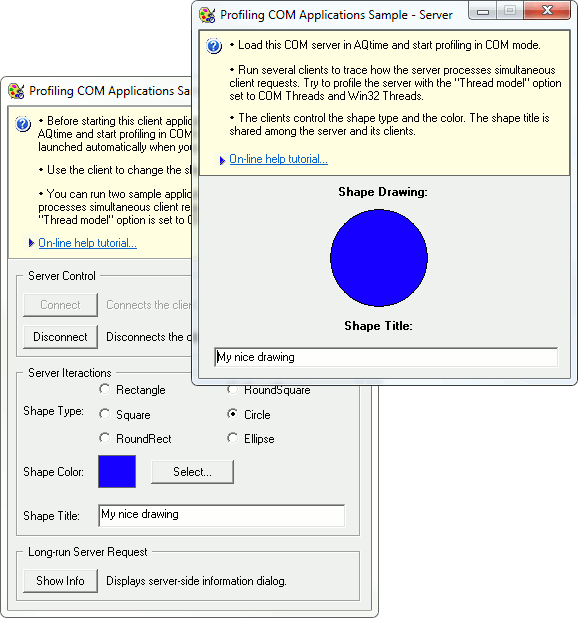
Once the client application is started, press the Connect button in it. This will launch the server application.
-
Now you can perform actions on the client and watch how they affect the server and vice versa.
-
In the client, click each of the shape types and see how the shape changes its form on the server.
-
Press Select in the client and choose the desired color in the resulting dialog. This will apply the chosen color to the shape on the server.
-
Type Drawing in the Shape Title box on the client and notice that the same string gets typed on the server.
-
Try the contrary: type Test message in the Shape Title box on the server and see how the same string appears on the client.
-
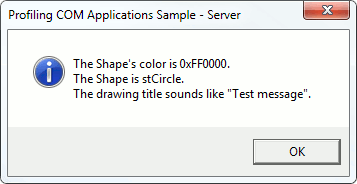
Press Show Info on the client and you will see that on the server this calls a message dialog like the following:
-
On the client, press Disconnect and then close the client application or simply close the client. Due to COM profiling mode, this will also close the server because there are no client connections to it. As previously mentioned, in Normal mode you would have to close the server application manually.
-
-
Upon closing the server, test results on the routines included in profiling will be displayed in AQTime’s panels. You can work with these results in the normal manner.

Click the image to enlarge it.

Click the image to enlarge it.

Click the image to enlarge it.
 Prev
Prev