After profiling is over, you get two result sets: one result set was generated when you clicked the  Get Results button and another result set was generated after the profiled application was closed.
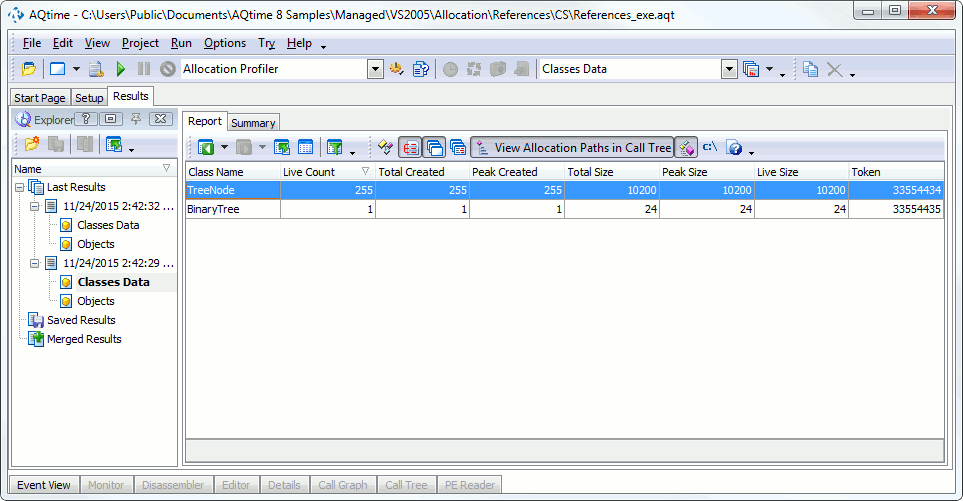
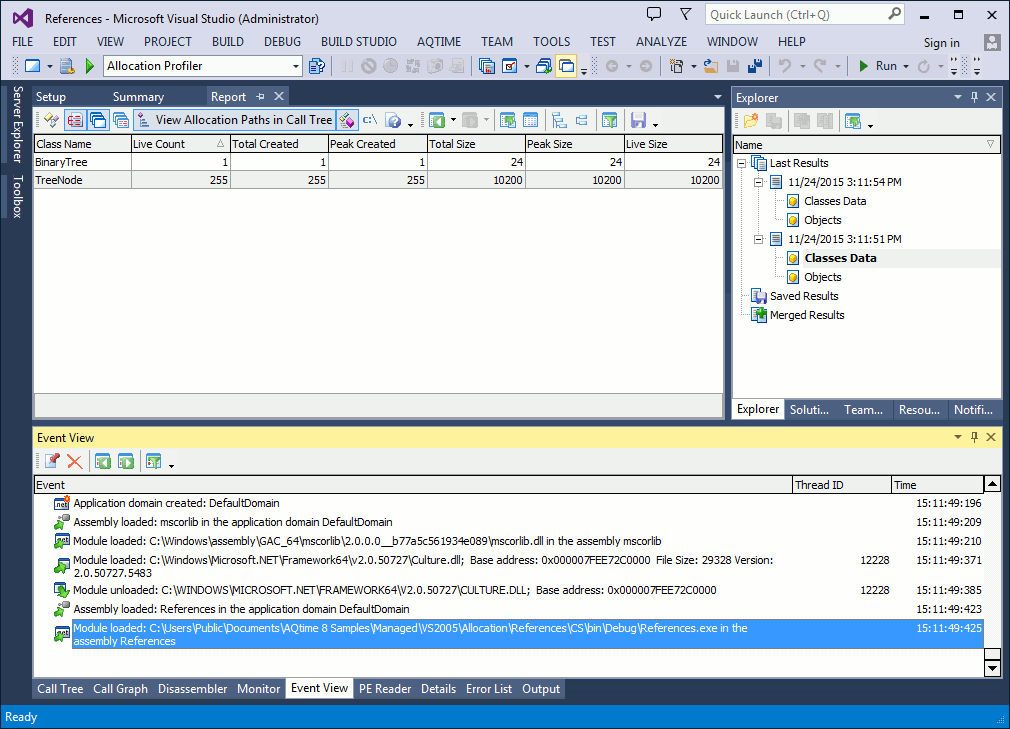
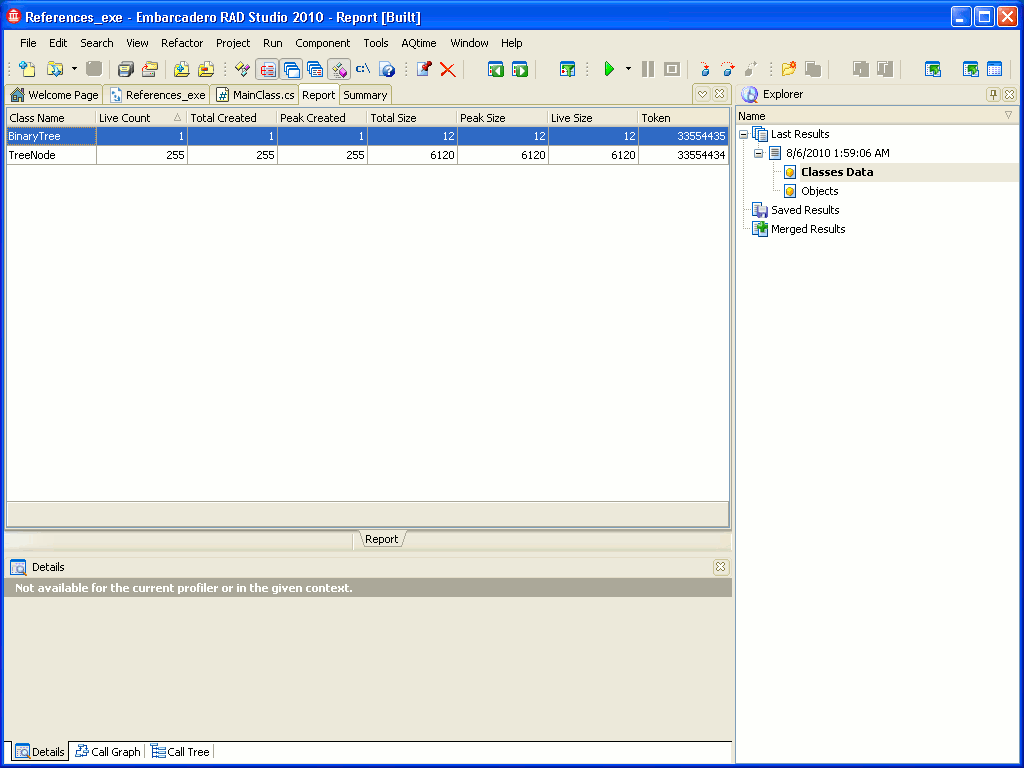
Switch to the Explorer panel and select the Classes Data category of the result set that was generated when you clicked the Get Results button. The Report panel will show results for classes:
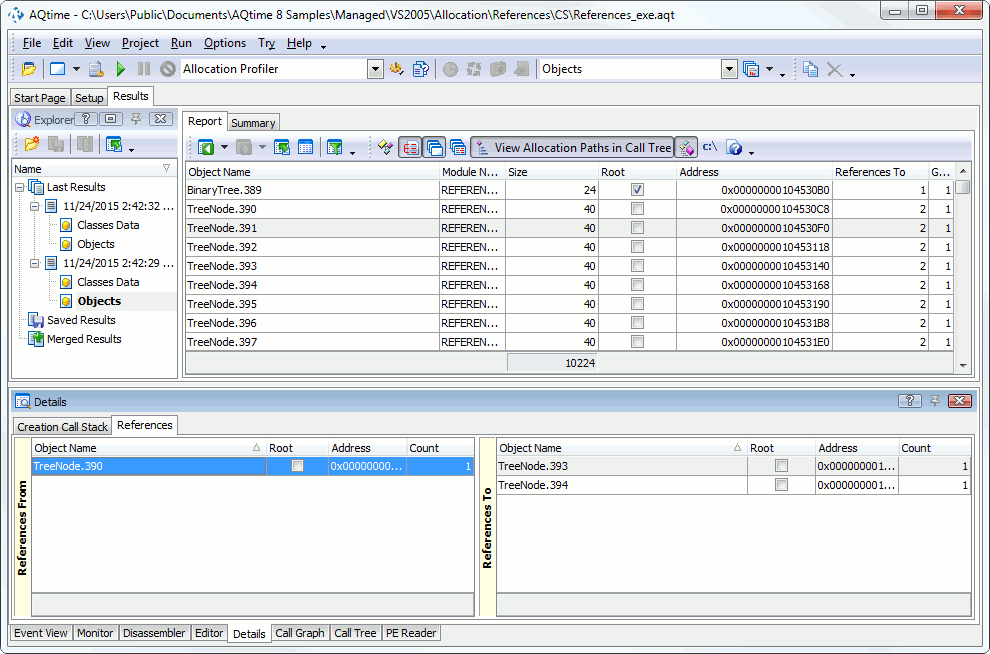
For both classes, the Live Count column is not zero. This means there are objects that existed in memory at the moment we got profiling results (though the garbage collector will certainly remove them). To view the list of the corresponding object instances, double-click the Objects category in the Explorer panel. As you can see, there are as many object instances as reported in the class list (255 instances for the TreeNode class and 1 - for BinaryTree).
To learn what objects refer to an object and what objects it refers to, select the desired object (for instance, TreeNode.10) in the Report panel and switch to the Details panel. The References From and References To panes will give you a detailed answer to the given question.
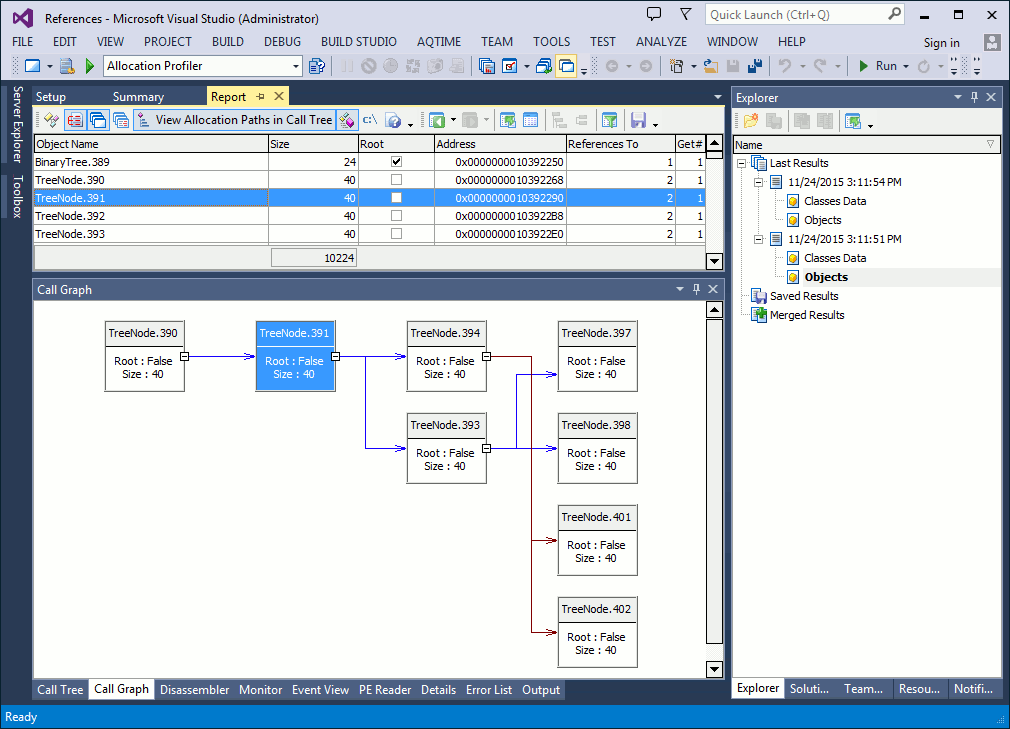
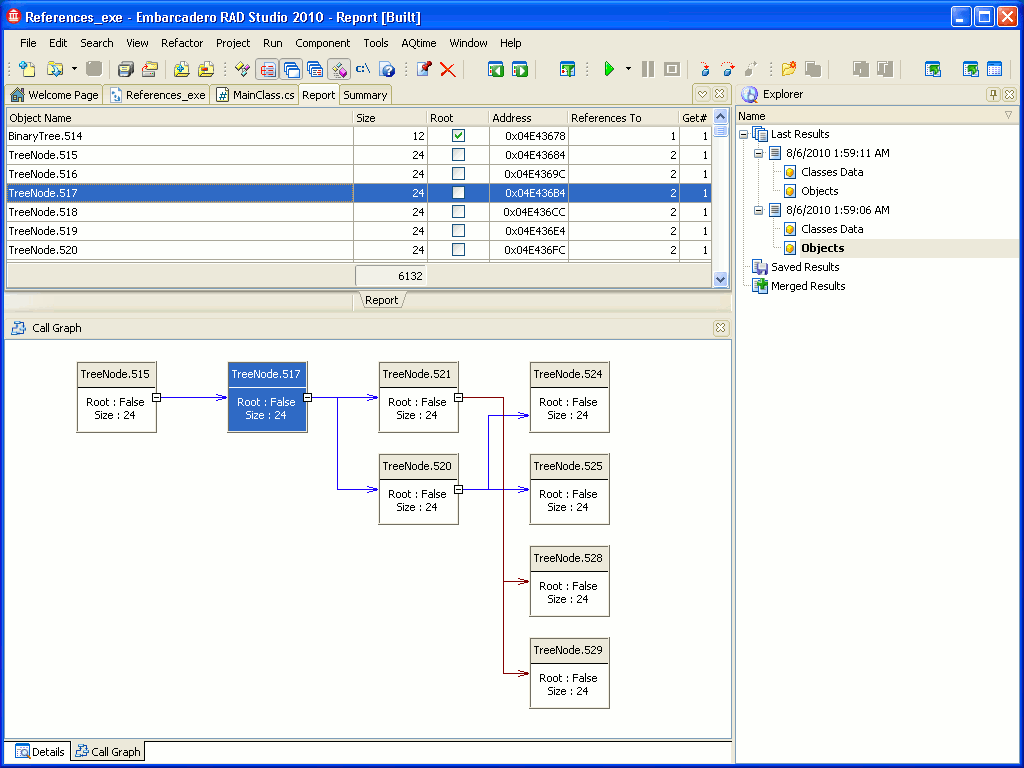
To view object reference information in a different form, switch the Call Graph panel. The selected object’s rectangle is blue. By default, the panel displays one level of objects that refer to the given object, and two levels of the object’s referees. To view the hierarchy of child nodes with more depth, you can increase the Number of child levels option of the Call Graph panel. In the following picture the Call Graph is shown with 2 child levels:
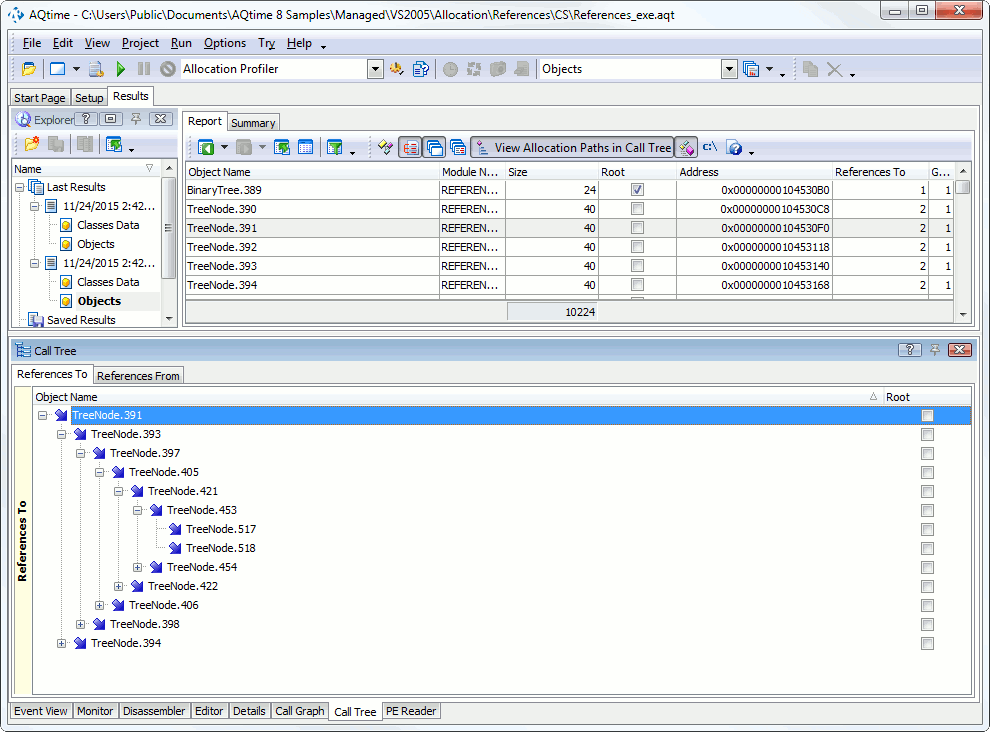
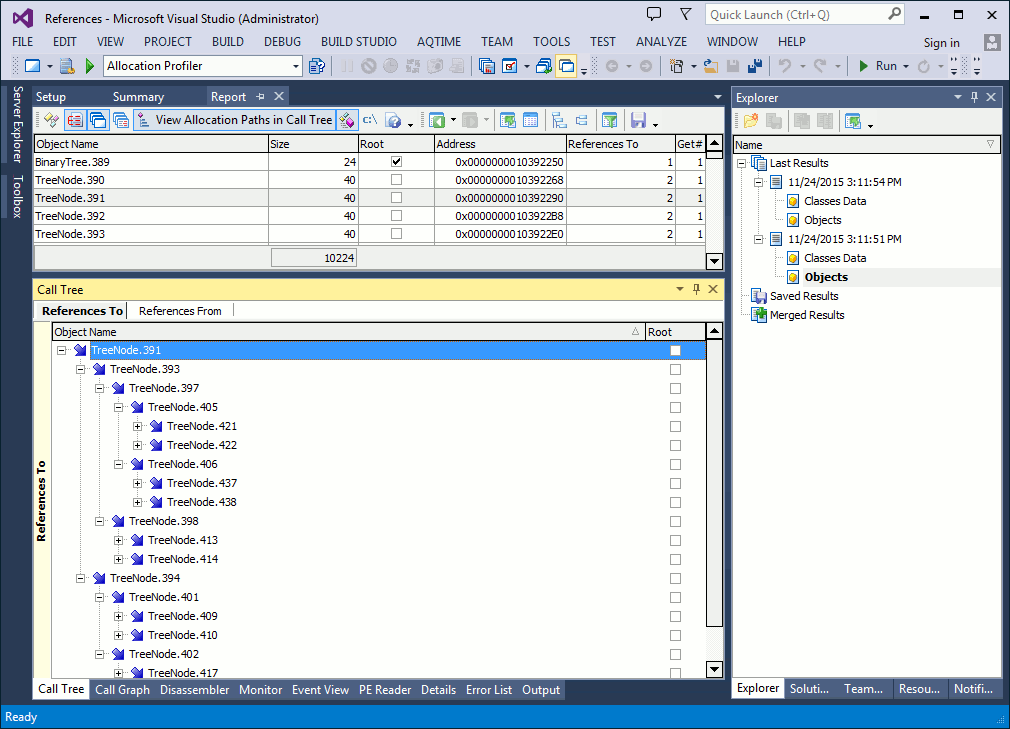
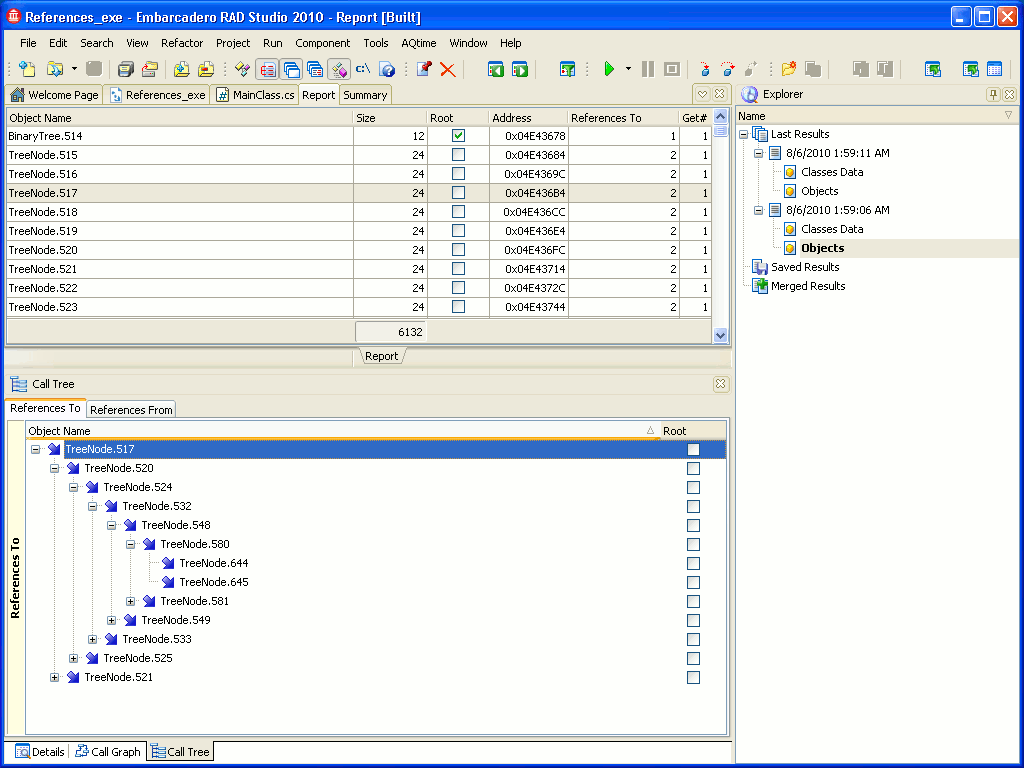
To view the entire tree of object references for the given object (one tree represents the object’s referers and another - its referees), switch to the Call Tree panel.
The Report and Details panels and the Editor’s gridthe Code Editor’s grid support custom summary fields, which can help you, say, to view the total size of all the objects listed in Report. Also, if there are more than one record selected in any of these panels, the summary fields display information that corresponds to the selected records, rather than to all records.



 Prev
Prev