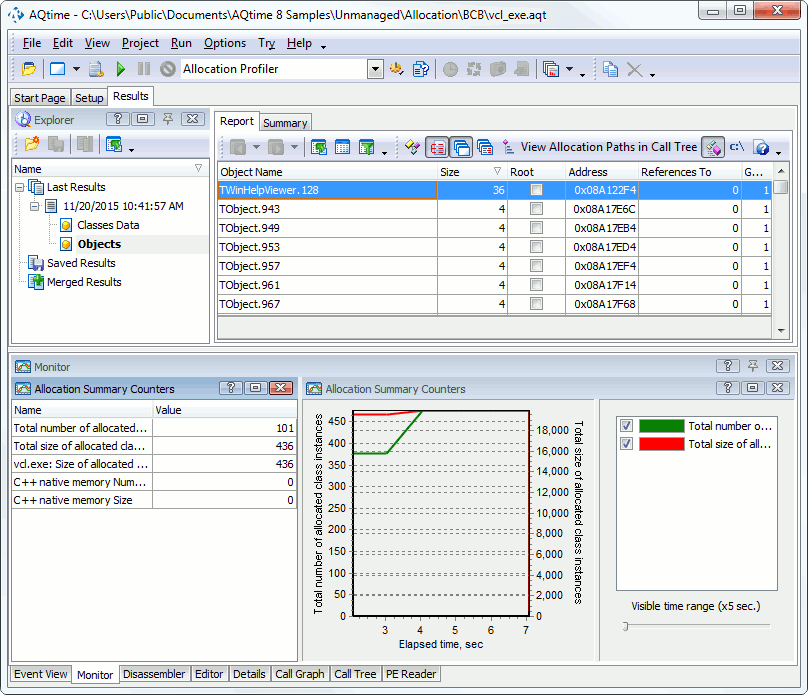
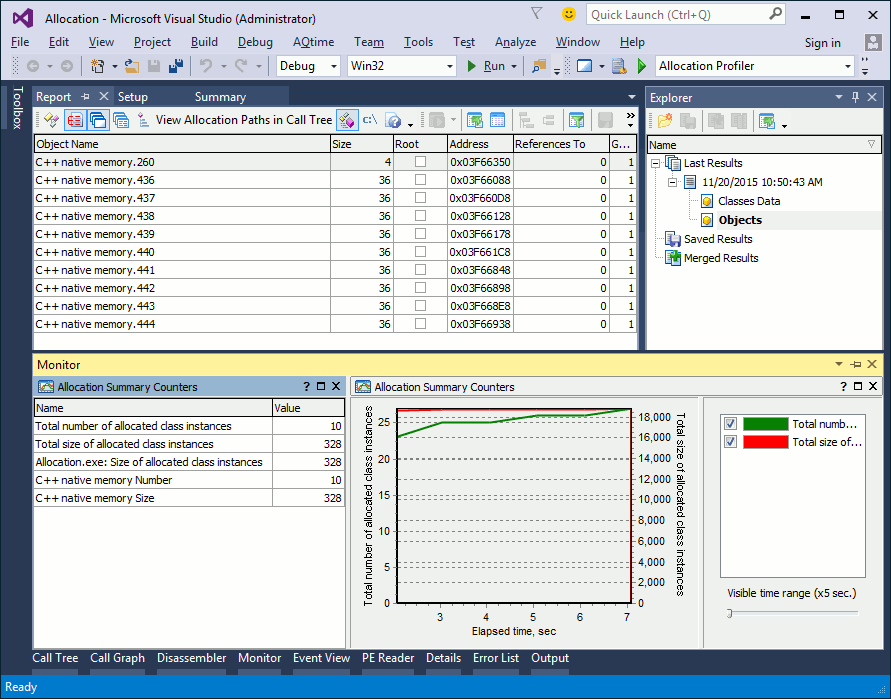
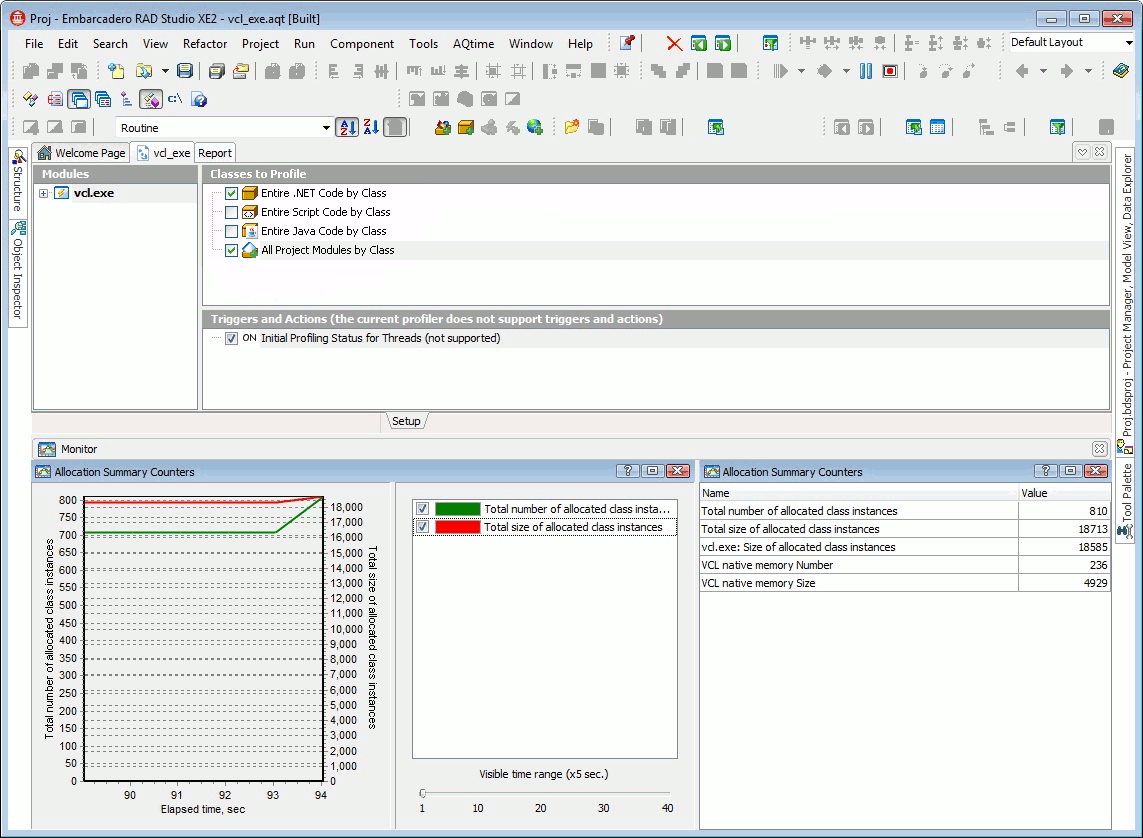
The Allocation profiler traces creation of objects and allocation of memory blocks during the application run. When the Monitor panel and the Allocation profiler are used together, the panel shows information on existing class instances and memory blocks in real time.
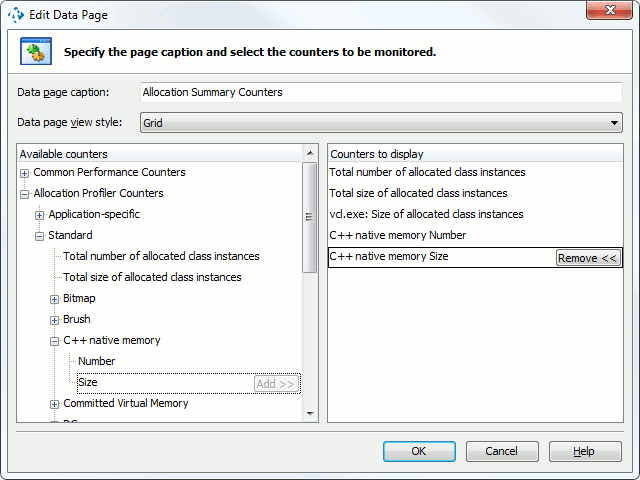
In order for the Monitor panel to display information on created class instances, you need to add counters to the Monitor's data pages. For each class, you can use two counters: Number (the current number of instances of the given class or the current number of allocated memory blocks) and Size (the total amount of memory in bytes that is currently occupied by all these instances or memory blocks). There are also counters that let you monitor the total size and number of allocated class instances. For information on available counters, see Counters.
To add a counter to the data page, you can use the Data Page dialog.
After the counters are added, the Monitor panel displays information about monitored classes during profiling.


