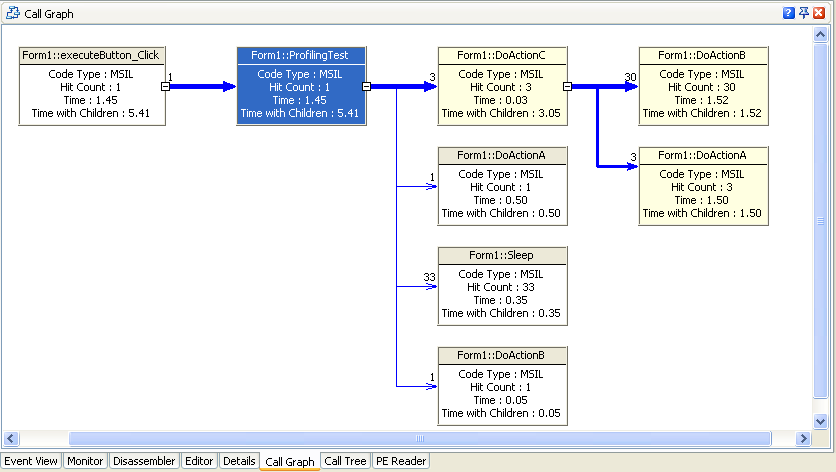
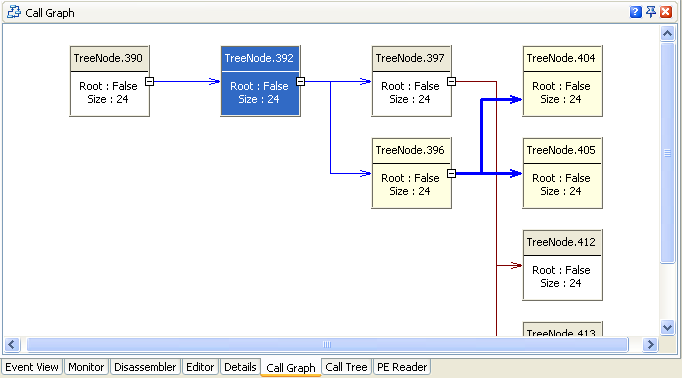
The Call Graph panel allows you to explore the hierarchy of calls in your application.
Panel Contents
The contents of a panel depends on the profiler that was used for collecting results:
- For the Performance, Reference Count and Function Trace profilers, Call Graph displays the hierarchy of calls for the object or routine clicked in the Report panel.
- For the Objects category of Allocation profiler results, the Call Graph displays the hierarchy of object references for the object clicked in the Report panel (this works only for managed code).
- For the Classes Data category of Allocation profiler results, the panel displays the hierarchy of function calls that led to creation of the class instance selected in the Report panel.

In order for the Call Graph panel to display allocation profiling results for the Classes Data category, the  View Allocation Paths in Call Tree button must be pressed on the Report toolbar.
 - For the Routines Data category of the Static Analysis profiler, the Call Graph displays the hierarchy of potential function calls in a convenient, visual format.
- For the Classes Data category of the Static Analysis profiler, the panel displays the hierarchy of method interlinks between classes.
In the upper part of the rectangle you can see the routine name and in the lower part the profiling results:
 |
When the Call Graph panel displays the Performance profiler results, it may display fake call routes. Also, according to its settings, the panel may display empty profiling results for some routines. For detailed information on these problems, see Tracing Call References - Specifics. |
In the object reference hierarchy, each object is represented as a rectangle and the arrows show the sequence of references between objects. In the upper part of the rectangle you can see the class name and instance number of the given object and in the lower part the object size.
Viewing Critical Path
Like the Call Tree panel for the Performance profiler, the Call Graph can display the critical path for the call hierarchy currently displayed. The critical path, which is highlighted in bold, is the "longest" route of all call routes in the graph. For instance, the route in which Time with Children is summarized for all routine calls that belong to this route is the longest of all routes of the graph.
The critical path allows you to determine which series of routine calls has the most significant effect on the performance of the profiled application. Optimizing routines that belong to the critical path will help you achieve optimization of the entire application faster. Note that since the Call Graph panel normally displays only a part of the entire call tree, the critical path displayed in the graph is local, applicable only to the current graph. To get the critical path for the entire application, turn to the Call Tree panel.
See Also
Call Graph Panel
About the Call Graph Panel
Working With the Call Graph Panel
Tracing Call References - Specifics

 Panel Contents
