
The Call Graph panel displays each function or class as a rectangle. The upper part of this rectangle holds the routine name or object's class name. The lower part displays profiler results (These results can be shown as a hint, if Call Graph's Show results as hint option is enabled).
Using the Customize Call Graph dialog you can specify what result values are to be displayed, the results' format, order, etc. To call the dialog, select Customize from the Call Graph context menu.
The contents of this dialog depends on the current profiler. If the current profiler is Performance, the dialog looks in the following way:
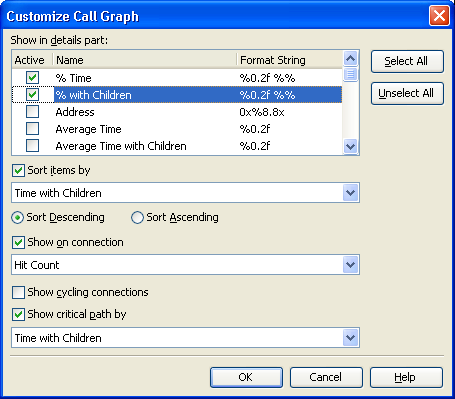
In the table at the top left of the dialog, you can select which results will be displayed in the Call Graph panel for each routine (object). To show (or hide) a result, simply check (uncheck) its Active box. Only checked results will be displayed. To check all available results, press Select All. To uncheck all the results, press Unselect All.
In the Format column you can specify the format for numerical results. For more information about the format string specifiers, see Syntax of the Format String.
Quite often the Call Graph displays several parent or child items for the currently selected item. In the Sort items by box you can select the value, by which items in the Call Graph will be sorted. Specify the sort order by selecting Sort Descending or Sort Ascending. Note that the sorting order applies to the items of the same level only, that is, when sorting parent items are not mixed with grandparent or with child items.
The Show on connection box lets you specify the values that will be used to label arrows on the graph. The value you select will be displayed at the arrow beginning (parent items) and at the arrow end (child items). The values displayed close to parent items have the same meaning as results in the Parents table of the Details panel (for the Performance profiler) or results in the References From page of Details (for the Allocation profiler). The values displayed at child routine have the same meaning as results in the Children table of the Details panel (for Performance) or results in the References To page of Details (for Allocation).
The Show cycling connections box specifies how the Call Graph displays information on function calls and object references. If this box is disabled, the Call Graph displays a separate rectangle for each function call (or object reference) in a route. For instance, if there are two routes, in which the function was called, there will be one rectangle per route. If the box is enabled, the Call Graph uses a single rectangle for all function calls (or object references). Note that in this case, the Call Graph may display empty profiling results for a routine (see Tracing Call References - Peculiarities).
If the Show critical path for column box is enabled, Call Graph highlights the critical path (with bold) for the routines or objects it displays. The critical path is the longest route in Call Graph calculated by a particular criterion. In this box, you can also specify the value that will be used as the critical path criterion.