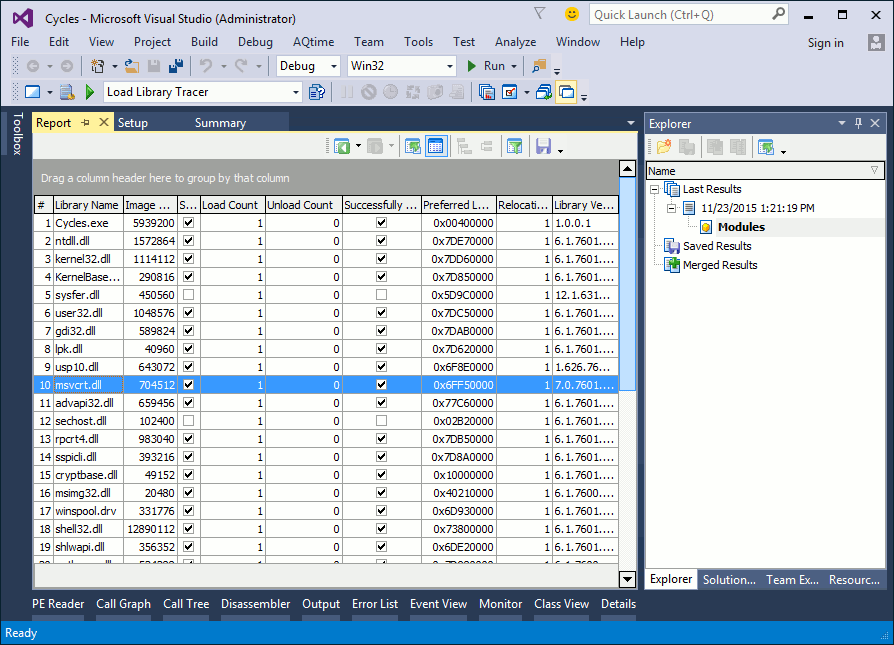
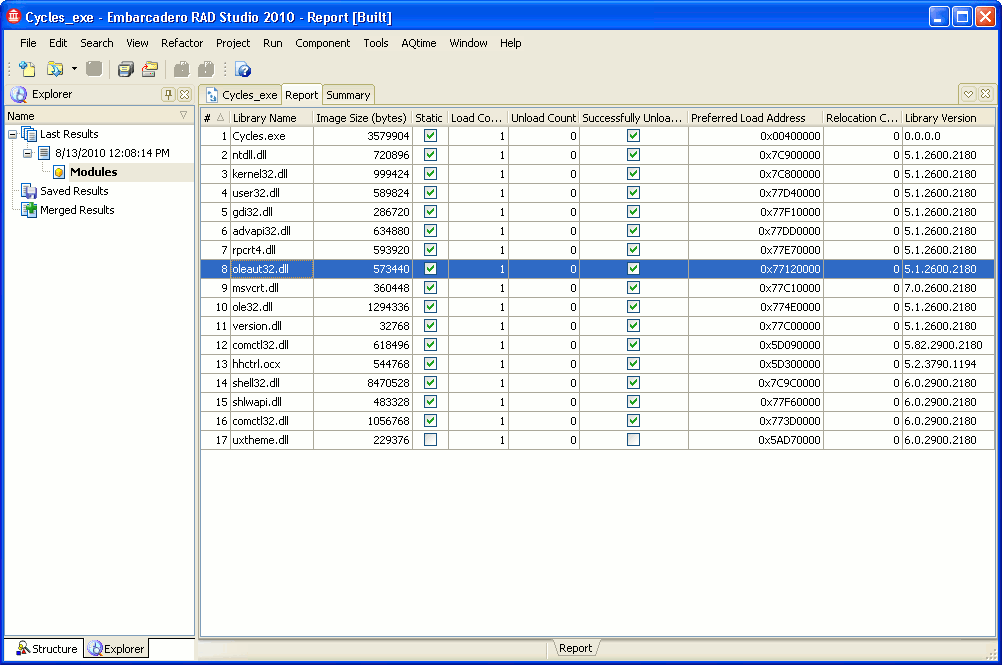
The Load Library Tracer profiler reports dynamic link libraries loaded and unloaded by your application at profiling time. Profiler results are generated upon closing profiled applications. Note that the  Get Results command is unavailable for the profiler.
| Note: | Profiling results also include the active module of your AQTime project since this module is also loaded to and unloaded from memory at profiling time. |
The following sections provide a brief overview of results and panels that hold them:
Viewing Summary Profiling Results
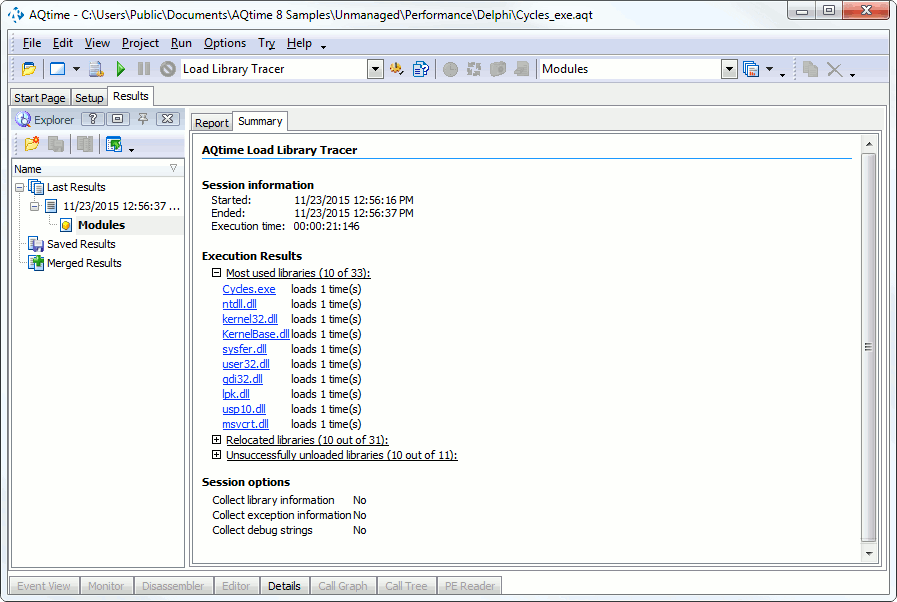
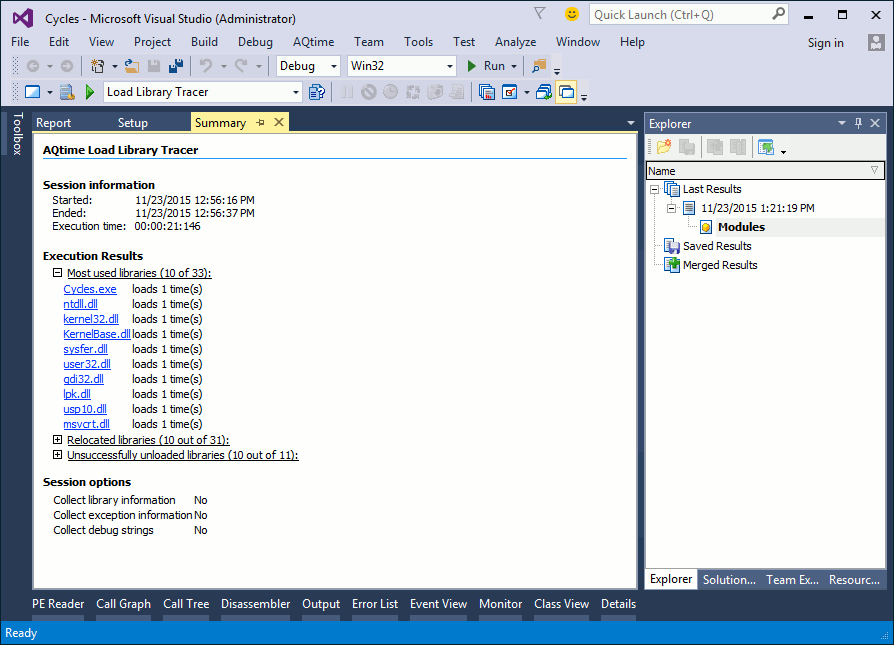
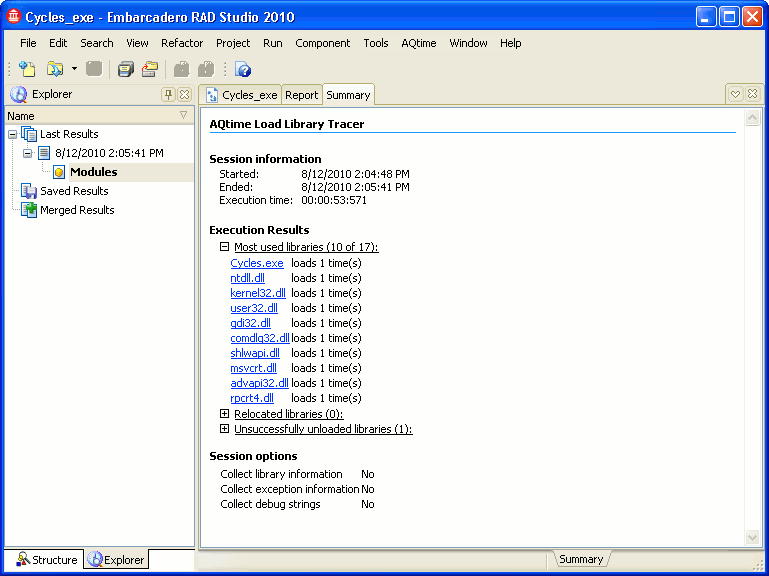
The Summary panel displays brief profiling results. It lists most frequently used libraries, relocated libraries and so on:
Viewing Profiling Results
Detailed information on loaded and unloaded modules is displayed in the Report and Details panels.
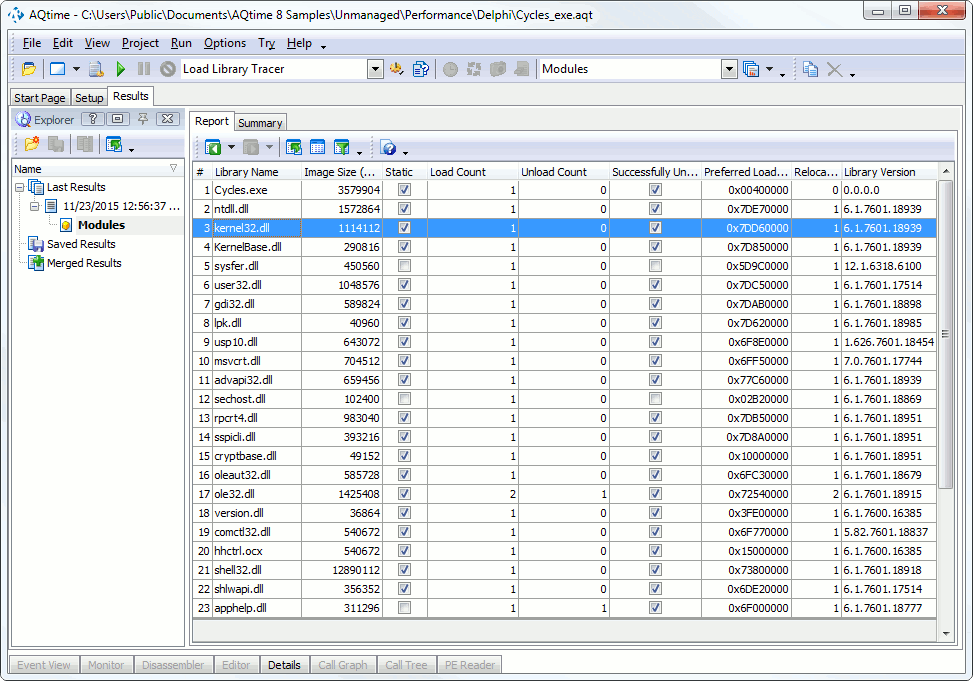
The Report panel displays a list of modules loaded to and unloaded from memory during the profiling time. Here is sample profiler output:
The panel columns indicate the module name, the number of loads and unloads, the file size and other information on libraries.
To determine DLLs loaded multiple times, analyze the Load Count column. This column displays how many times the library was loaded in memory. Large values in this column point to possible ineffective usage of the DLL.
For information on other Report panel columns, see Load Library Tracer - Report Panel.
Note that the Report panel does not contain all of the available columns by default. You can add columns to the panel at your desire. See also Arranging Columns, Lines and Panels for information on how you can tune AQTime panels.
Viewing Additional Information
To view information on library loading, double-click the desired library in the Report panel and switch to the Details panel. This panel contains two tables: Module Instances and Call Stack:
Each row of the Module Instances table corresponds to loading of the DLL in memory. When you select a row within the table, the Call Stack displays the sequence of function calls that led to loading the library in memory.
For information on table columns, see Load Library Tracer - Details Panel.
See Also
Load Library Tracer Results
Load Library Tracer
Load Library Tracer - Overview

 Viewing Summary Profiling Results