The Coverage profiler results are divided into three categories: Routines, Modules and Source Files. When the Source Files category is selected, each row in the Report panel corresponds to a single source file of your application.
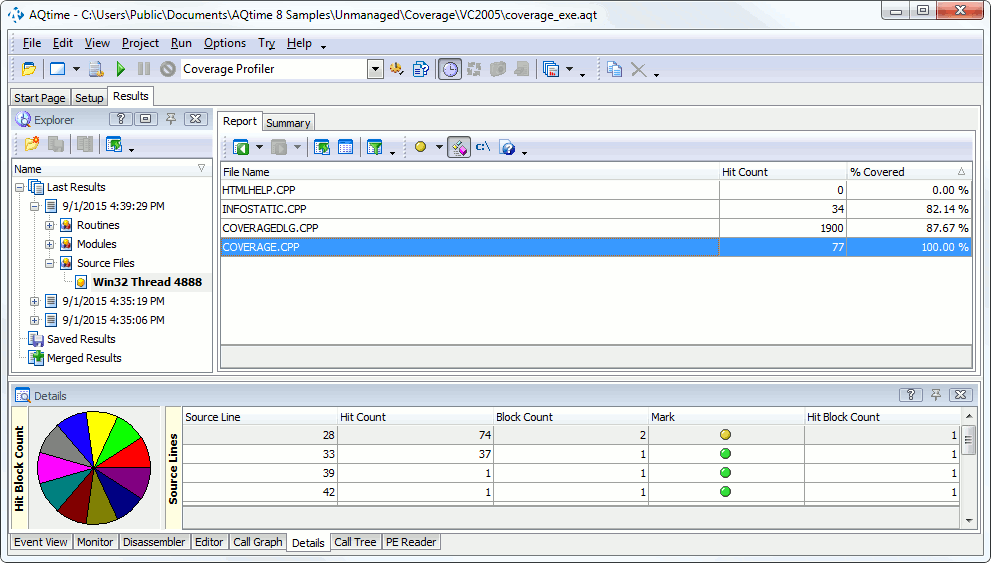
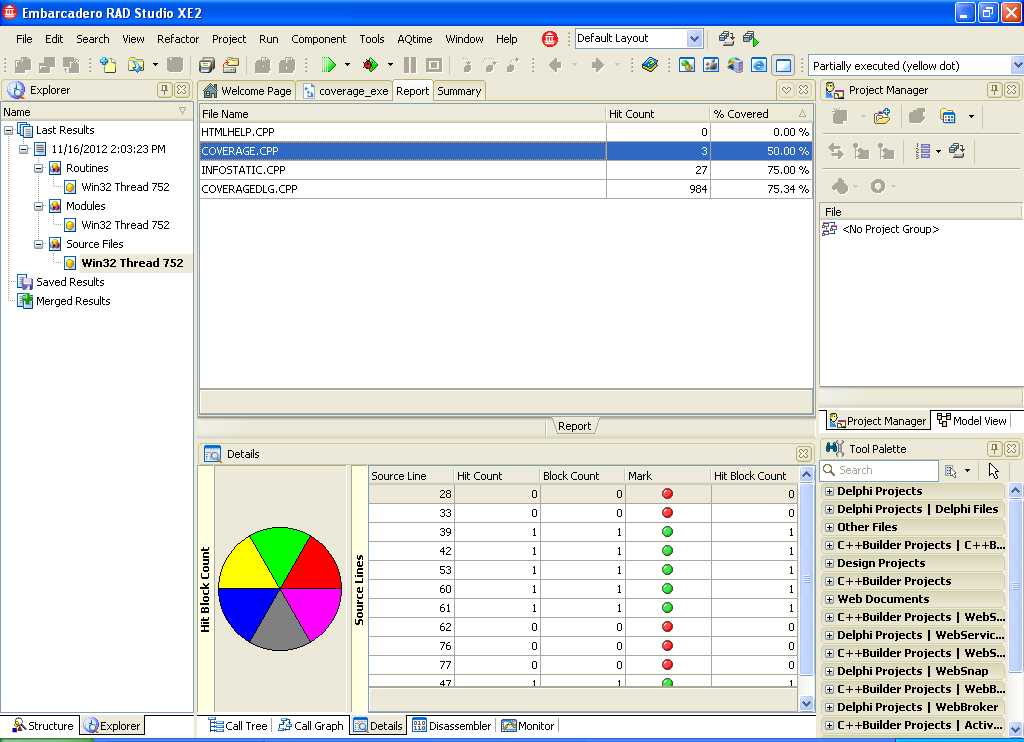
Below is a sample output of Coverage profiler results displayed in the Source Files category:
The following sections describe what information about source files you can obtain from profiling results:
Viewing Profiling Results
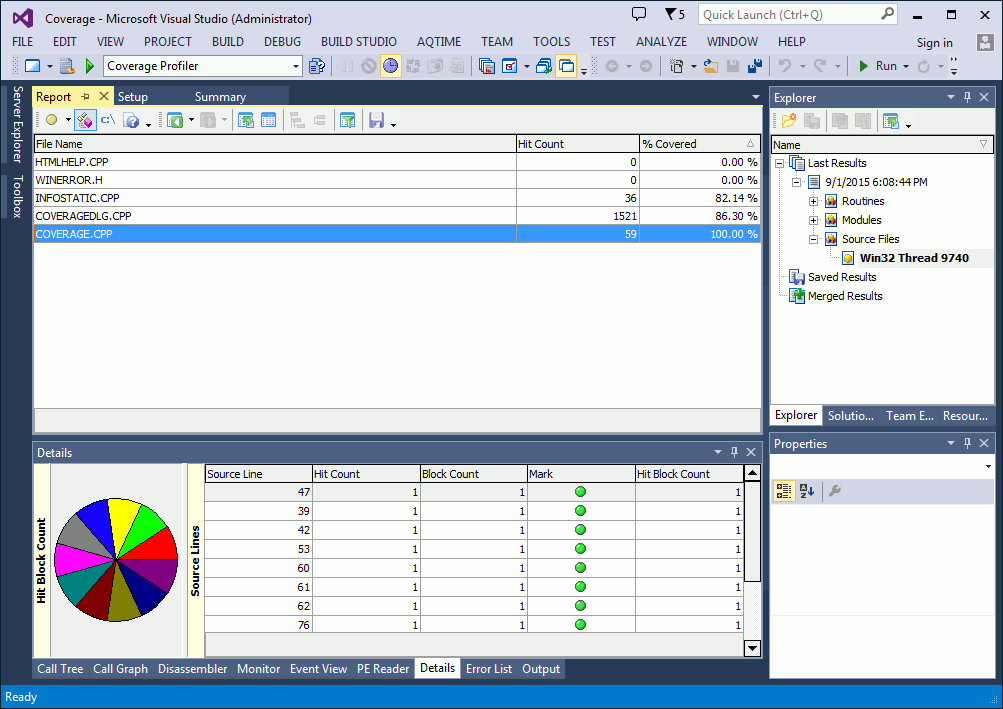
Every row in the Report panel holds results for an individual source file:
-
Source files' names are specified in the File Name column.
-
The Hit Count and Skip Count columns show the number of routine calls that were profiled and excluded from the profiling respectively.
-
The % Covered column shows the overall percentage of covered lines in the given source file. Use the value of this column to estimate whether your automated tests completely cover individual application files.
Note: Partially executed lines are counted according to the Mark partially executed lines as option value. For more information on this, refer to the Profiling Partially Executed Lines topic.
For a detailed description of the columns refer to Coverage Profiler Panels Reference.
Viewing Additional Information
If the code was profiled at the line level, you can see additional results in the Details and Editor panels.
Details Panel
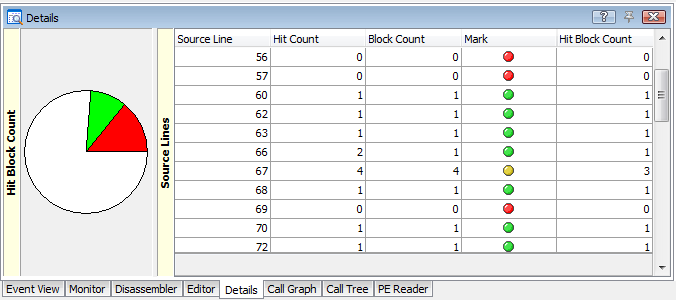
The Source Lines pane of the Details panel holds line coverage profiling results for the source file selected in the Report panel. You can work with rows on the Source Lines pane in the same manner as you work with rows in the Report panel. The chart on the left of the Details grid graphically illustrates profiling results.
Each row in this page corresponds to an individual source code line. AQTime marks executed lines with a green dot, unexecuted lines with a red dot and counts partially executed lines according to the Mark partially executed lines as option value. For more information on this, see the Profiling Partially Executed Lines topic.
For the full list of available columns, see Coverage Profiler - Details Panel.
Editor Panel
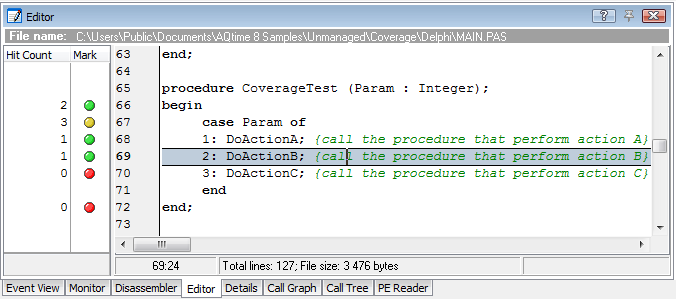
If you double-click a row in the Details grid, the cursor will be moved to the appropriate row in the source code displayed in the Editor panel. The Editor’s grid shows the same results as those shown in the Details panel. For instance, you will find that the executed function and lines are marked with green dots and the unexecuted routines and line have red dots. The partially executed routines and lines are marked with yellow dots and counted according to the Mark partially executed lines as option value.
To select which columns to display in the gutter, use the Field Chooser window. To bring it up, select Field Chooser from the context menu. See Adding and Removing Columns.
 |
The Code Editor of Visual Studio lets you collapse and expand blocks of source code. The grid which AQTime adds to the Code Editor to display profiling results supports neither collapsing nor expanding because Visual Studio does not send appropriate notifications to AQTime. To ensure that the grid shows proper profiling results for source lines and routines, please expand all collapsed blocks of code. To do that, use the Outlining > Toggle All Outlining or Outlining > Stop Outlining item of the Code Editor’s context menu. |
 |
The Editor of Embarcadero RAD Studio lets you collapse and expand blocks of source code. The grid which AQTime adds to the Editor to display profiling results, supports neither collapsing nor expanding because Embarcadero RAD Studio does not send appropriate notifications to AQTime. To ensure that the grid shows proper profiling results for source lines and routines, please expand all collapsed blocks of code. To do that, use the Unfold > All item of the Editor’s context menu. |
Also, see some notes on the Editor panel's specifics in the Coverage Profiler - Results of the Routines Category topic.
For the full list and detailed description of panels' columns, see the description of the Details and Editor panels.
See Also
Coverage Profiler Results
Report Panel
Explorer Panel
Details Panel
Analyzing Profiler Results

 Viewing Profiling Results