This topic describes the changes made to AQTime 5.0. For information on the changes made to other versions of the product, see Version History.
Supported Applications
-
Support for 64-bit Applications. All AQTime profilers now support 64bit applications. All AQTime panels also support 64bit code. For instance, you can view 64bit binary code in the Disassembler panel and explore dependencies between 64bit modules with PE Reader.
-
Windows x64 Editions Support. You can profile COM, DCOM, COM+, service, IIS and ASP.NET applications on 64bit versions of Windows operating systems (Windows XP Professional x64 Edition and Windows Server 2003 x64 Edition).
Profiling Improvements
-
New Function Trace Profiler. AQTime includes a new Function Trace profiler that has been greatly improved in version 5. The profiler not only traces the sequence of function calls at real time, but also times the function execution and logs function call parameters. The profiler supports 32bit, 64bit and .NET code. See Function Trace Profiler Overview for more information.
-
Improved Allocation profiler.
-
Now the Allocation profiler includes filters for known memory leaks of MFC and VCL libraries. By using a new
 Filter leaks button on the Profiler toolbar, you can employ these filters and exclude MFC and VCL leaks from your profiling results. That is, you can exclude the leaks, which you cannot fix, and concentrate on inaccuracies of your code (if any).
 -
The Allocation profiler now reports the class names for leaked objects in Visual C++ and C++Builder applications. In earlier versions, the profiler detected C++ object leaks, but reported them under the C++ native memory class name.
-
The Allocation profiler now traces the allocation and de-allocation of memory blocks that are performed with Windows API functions (see Tracing System Memory Management Functions). The profiler also includes a new Check system memory allocations option that enables or disables this functionality.
-
A new Thread model option has been added to the Allocation profiler. It lets you specify the thread model, which the profiler will use to unwind the call stack for functions that allocate memory blocks.
-
-
New Load Library Tracer Profiler. With this profiler you can trace the use of dynamic link libraries in your application and detect bottlenecks that occur due to frequent loading and unloading of libraries. See Load Library Tracer for more information.
-
New Clear Results command. In addition to the Get Results command, AQTime now has a new Clear Results command that allows you to clear unwanted previous results before generating new results. Using this feature you can obtain accurate results for the needed periods of application functioning. See Clearing Results During Profiling for complete information.
Visual Studio .NET Integration Enhancements
-
Run Command Integration. You can start profiling your application with Visual Studio’s
 Run button or Debug > Run menu item. This feature works when an AQTime project is added to a solution and any AQTime panel is active. If an AQTime panel is not active, the application runs without profiling.
 -
Context Submenu for Profiling. The Code Editor’s context menu now has the Profile submenu. This submenu allows you to profile the routine where the cursor is currently located in the code, the class where the cursor is located or the entire edited source file. Selecting the corresponding submenu item adds the specified routine, class or source file to an including area and starts profiling. For more information on this read the Adding Code to Areas topic.
-
Profiling Results as Hint. Now you can view line and routine profiling results when you hold the mouse pointer over summary bullets that are shown for source lines in the Editor’s grid. If a routine was profiled at line level, the hint will display profiling results of the appropriate line. If the routine was profiled at routine level, the hint will display profiling results of the routine, to which the line belongs.
Other Improvements
-
Auto Upgrade. Now, AQTime not only automatically checks if a new major version is released, but also whether a new patch is available. If a new patch is found AQTime prompts you to download it for free. This feature assures that you are using the latest obtainable version of AQTime. Still you can manually check for updates and patches with the Check for Updates menu item. See Checking for Updates for more information.
-
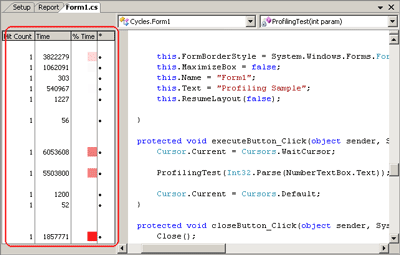
New data display format for the numerical columns. AQTime 5 offers a new format for displaying numerical columns - Color. When this format is selected, a column displays a square mark where the fill color indicates the underlying percentage value. Color and Graph Bar indicators are great for visual comparisons. See the Changing Column Format and Format Columns Dialog topics for more information. The new format can also be used for displaying results in AQTime when integrated into Microsoft Visual Studio and Borland Developer Studio.

-
Plug-In API samples and help. You now have full access to AQTime’s engine for creating new profilers. See Creating Custom Plug-Ins for more information.
