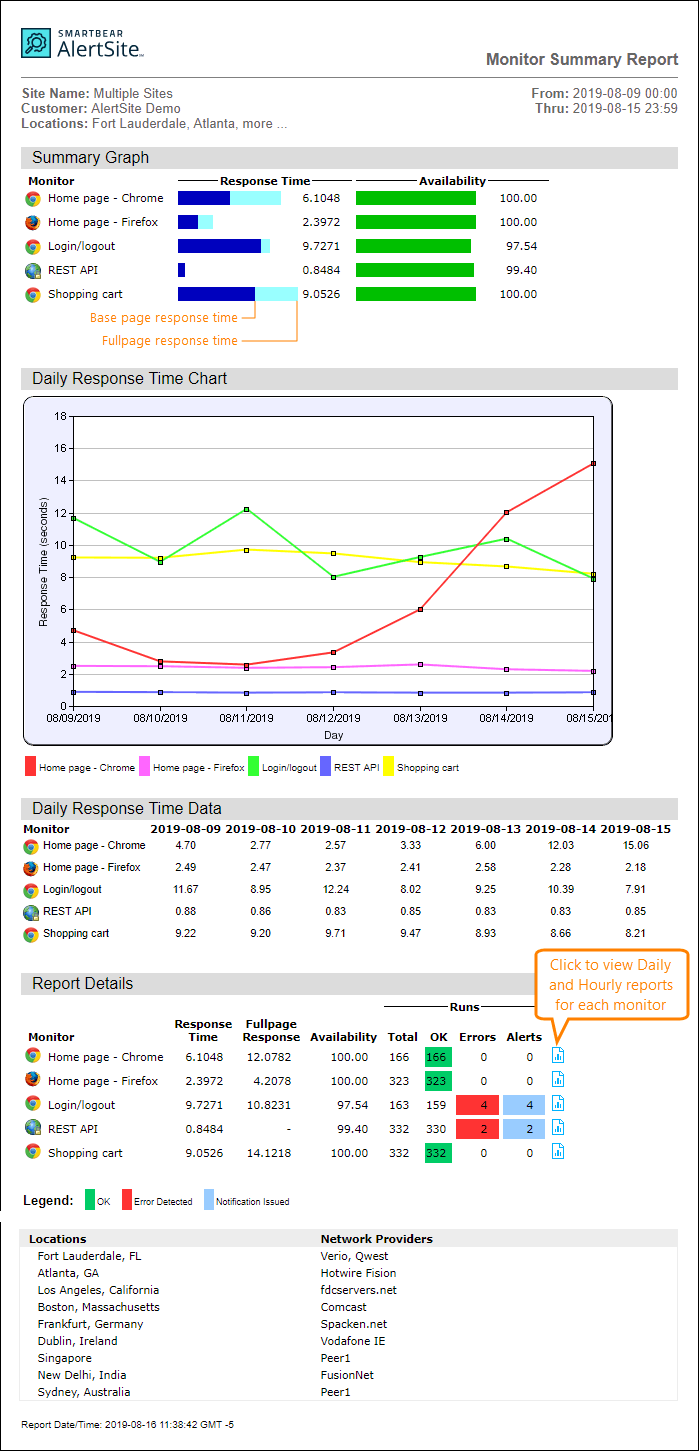
The Monitor Summary report shows the average availability, response time, and status summary (OK vs errors) for one or more monitors over the selected period.
This report is similar to the Summary Statistics report, except it can also include hourly, daily, weekly or monthly averages, and does not include warning statuses.
Report options
When creating a report, you can customize the report contents by using the following options. The report must include at least Graphs or Report Details.
-
Graphs – Adds the Summary Graph section that shows the average response time and availability of each monitor over the report period.
-
Trend Chart – A chart of the average response time per hour, day, week, or month (as specified by the Time Segment option). The response time here is the base page response time, not the full page response time.
-
Data Table – Same as the previous option, but the data is in a table.
-
Report Details – A table that shows the average response time, availability, and a status summary of each monitor over the report period. The
 icon in each row opens the Daily and Hourly reports for each monitor.
 -
Location List – A list of locations used by the selected monitors.
-
Time Segment – For reports created with the Trend Chart and Data Table options, select the time interval (hour, day, week, or month) to average the response time over.
Report columns
For a description of the report columns, see Report Column Descriptions.

