
The Alert Log shows all alerts triggered by your monitors and locations over the selected time frame – last 24 hours, 7 days, or 30 days. It shows which monitors triggered alerts, and who was notified about the problems.
AlertSite UXM
To open the Alert Log, click ![]() Compare Monitors on the AlertSite UXM Dashboard and switch to the Alert Log tab.
Compare Monitors on the AlertSite UXM Dashboard and switch to the Alert Log tab.

Click the image to enlarge it.
Select monitors to compare
Compare two or more monitors
-
On the toolbar of the Dashboard, click
 Compare Monitors, and then switch to the Alert Log tab.
 -
On the left, select the check boxes next to the monitors you want to compare.
Compare all monitors in a group
On the Dashboard, click on a group tile, select ![]() Compare Monitors, and then switch to the Alert Log tab.
Compare Monitors, and then switch to the Alert Log tab.
Remove a monitor from comparison
Clear the check box next to the monitor name in the Selections panel on the left.
AlertSite 1.0
To open the Alert Log, select Dashboard > Notifications from the top menu.

Click the image to enlarge it.
Column descriptions
The Alert Log has the following columns:
| Column | Description |
|---|---|
| Monitor (Device name in AlertSite 1.0) |
The name of the monitor that triggered this alert. Private node connectivity alerts display PrivateNode Monitors in this column. |
| Type | The message type: Clear, Error, TCP traceroute, and so on. |
| Count | The number of recipients the alert was sent to. |
| Alert Type (Class in AlertSite 1.0) |
The alert type: Availability or Performance. |
| Location | The monitoring location that triggered this alert. |
| Date & Time (or Date/Time in AlertSite 1.0) | The date and time when the alert was sent. |
| Recipient | The users who were notified. |
| Method | Notification method: email, phone call, and so on. |
See who received an alert
Expand the alert on the list to see the list of recipients this alert was sent to.
Find and filter alerts
You can filter alerts by the monitor name, alert type (availability/performance), and message type (error/clear).
Type into the search box to filter the alert log.
View alert contents
To view the contents of an alert, expand the alert and then click a specific recipient (in AlertSite UXM) or click the link in the Type column (in AlertSite 1.0).
Export to CSV
In AlertSite UXM, you can export the alert log to a CSV file. To do this, click Export CSV in the top right corner of the page.
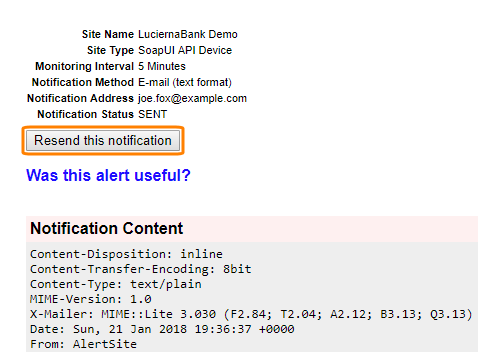
Resend an alert
AlertSite 1.0 lets you resend alerts if necessary. To do this, view the alert contents as explained above, and click Resend this notification.
Alert log as a report
You can export alert log data as a report. The corresponding report type is Notification Detail. You can create or schedule this report in Reports > Performance Reports.