
The Load Profile Graph section of the Report panel shows the relation between the number of simulated virtual users and the test execution time. In other words, it shows how many users were simulated at any given moment of the test run.
Viewing the Graph
-
Open the desired Report item (if it is not open yet). To do that, expand the test log item node under the Project_Name Logs folder in the Project Explorer and double-click its child Report node.
-
In the Report panel, select the Summary tabbed page.
-
Expand the Load Profile Graph section.
Requirements
To view the graphs and charts shown in the Report panel, install Flash Player 8 or later for Windows Internet Explorer on your computer. You can download the latest version of the player from the Adobe web site:

Description
A sample view of the graph is as follows:
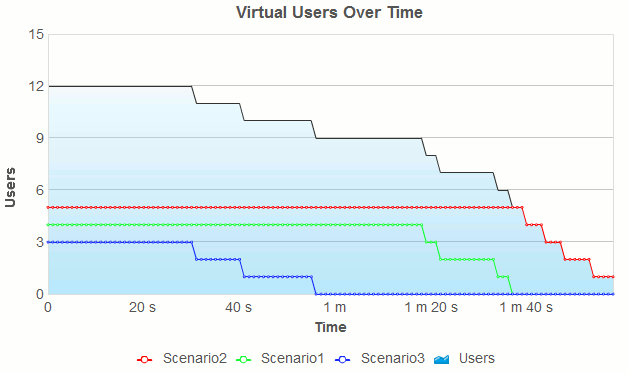
If you simulated a continuous load, used a load profile or if your test runs a single scenario, this graph may look a bit different.
If you compare the results of two test runs, LoadComplete displays only the Users series from both reports for comparison. The graph does not include the number of virtual users per scenario in each test.
To see the exact value of a metric at a specific moment, hover the mouse pointer over the needed data point on the graph – the metric value will be shown in a tooltip.
Printing the Contents of the Report Panel
Note that LoadComplete shows the data shown in the graph in the tabular format. An appropriate table is shown under the Load Profile graph when you start printing the contents of the Report panel, that is, when you click Print on the panel's toolbar.
The above-mentioned table contains the following columns:
| Column | Description |
|---|---|
|
Time |
Contains time values from 0 to the test execution time in increments of one second. |
|
Scenario_Name |
Contains the number of virtual users that were simulated at certain moment and were assigned to the Scenario_Name scenario. This column is shown for each scenario used during the test run if the total number of specified scenarios is more than one. This column is not shown for tests simulating one scenario and for comparison reports. |
|
Users |
Contains the total number of virtual users that were simulated at certain moment. |
More Information
For more information on working with the graphs and charts shown in the Report panel, see Viewing the Report Charts and Graphs.
See Also
Summary Page of the Report Panel
Report Panel
About Test Results
Test Result Panels
Creating and Configuring Load Tests
Viewing Report Charts and Graphs