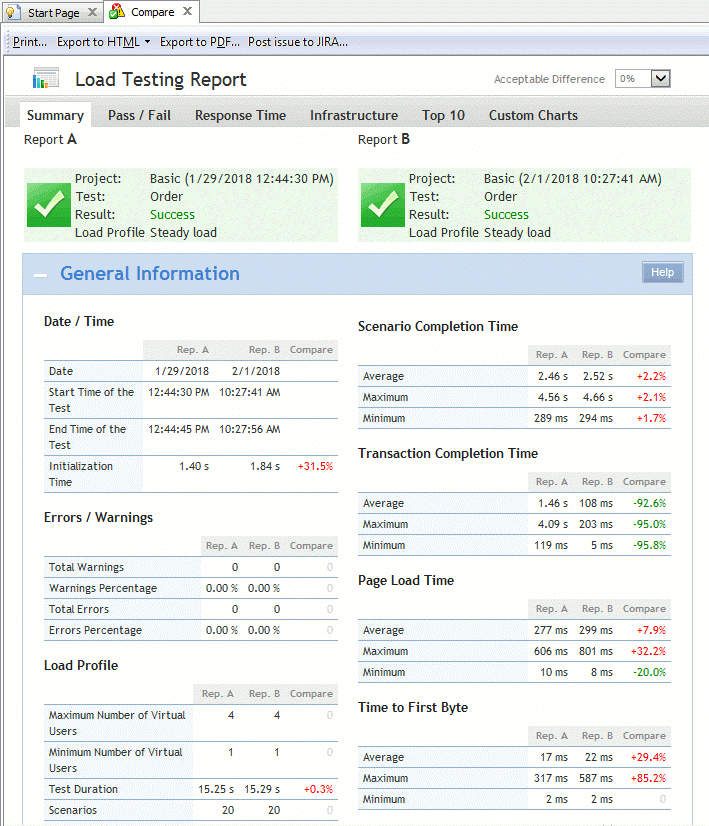
You can compare two test reports to see how your web site performance changes from one test run to another.
To compare results:
-
Click
 Compare Results on the toolbar. The Compare Results dialog will appear.
 -
In Report "A", select a baseline report.
-
In Report "B", select a report, which you want to compare with the baseline report.
-
Click OK.
The Report panel will show the comparison report. It looks like a usual report, but it shows the compared values and charts side-by-side along with the percentage difference.
The difference marked with green means improved performance, the red color indicates worse performance. You can use the Acceptable difference option in the report’s top right corner to select the minimum difference percentage that should be color-coded.
| Note: | Comparison reports may not include some results. For example, comparison reports for cloud tests do not include Chart by Region graphs. Comparison reports for scenarios that call subscenarios or for tests that simulate several scenarios do not include completion time for individual subscenarios. Similarly, comparison reports for scenarios that have several user-defined transactions do not include completion time for individual transactions. |
You can print and export comparison reports in the same way you do this when working with regular reports.

