You can compare two or more test run results to see how the performance of your web site changes from one test run to another. You do this by using the Compare Multiple Results wizard.
To call the wizard, click  Compare Multiple Results on the LoadComplete Test Engine toolbar.
1. Select Test Results to Compare
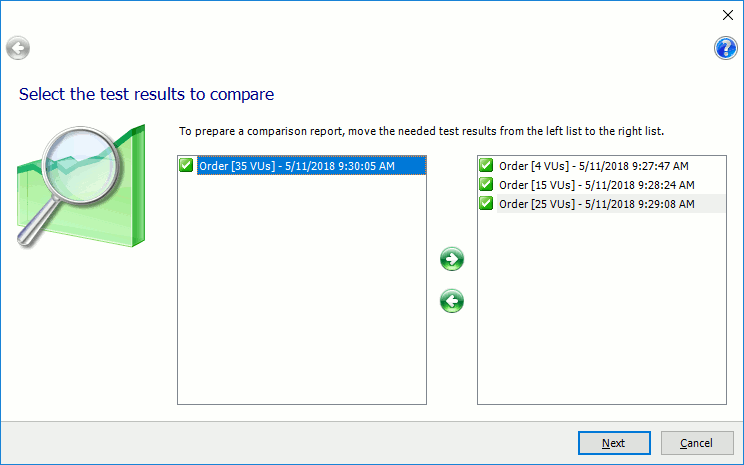
The first page of the Compare Multiple Results wizard lists all the test results of your project. Select the results you want to compare in the list on the left, and move them to the right list. You can use CTRL+ and SHIFT+clicks for multiple selection.
 Select two results or more. To compare two test results, you can also use the Compare Results wizard.
Click Next.
2. Select Metrics to Compare
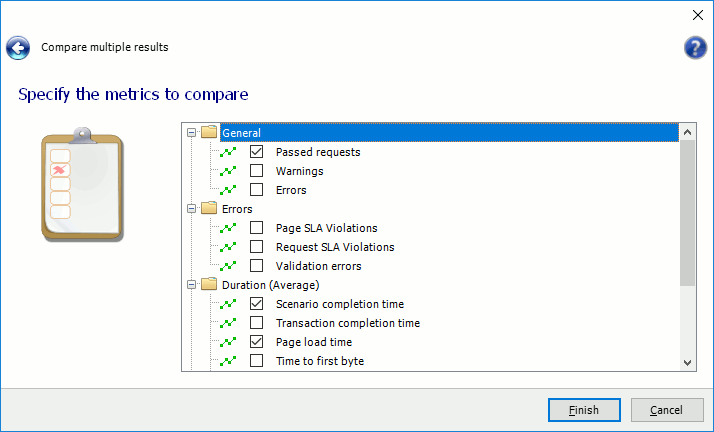
On the Specify the Metrics to Compare page of the Compare Multiple Results wizard, select the metrics you want to compare:
The following metrics are available:
General |
|||
| Passed requests | The number of requests simulated successfully. | ||
| Warnings | The number of warnings that occurred during the test run. | ||
| Errors | The number of errors that occurred during the test run. | ||
Errors |
|||
| Page SLA violations | The number of times the Max Page Load Time SLA criterion was violated. | ||
| Request SLA violations | The number of times the Max Time to First Byte SLA criterion was violated. | ||
| Validation errors | The number of failed validations. | ||
Duration (Average) |
|||
| Scenario completion time | The average time it takes to simulate a scenario.
|
||
| Transaction completion time | The average time it takes to simulate a transaction.
|
||
| Page load time | The average time it takes to download the entire page, including all its resources (images, script files, CSS files, and so on). | ||
| Time to first byte | The average time passed between the first byte of the simulated request and the first byte of the resulting response. | ||
| Time to last byte | The average time passed between the first byte of the simulated request and the last byte of the resulting response. | ||
Duration statistics |
|||
| 90th, 95th, 95th and 99th percentile response time | The response time value that covers 90%, 95%, 98% and 99% of requests respectively. | ||
Click Finish.
3. Comparison Report
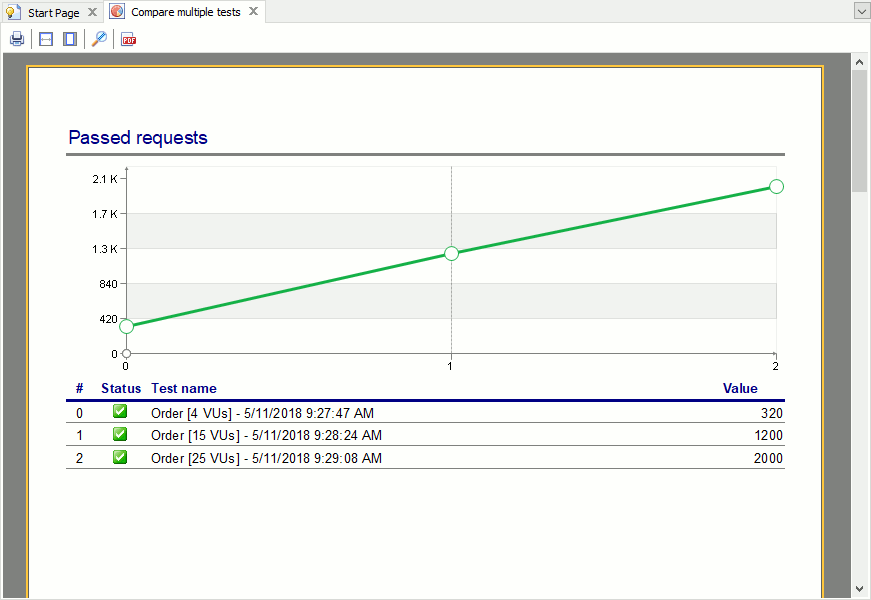
LoadComplete will compare the selected metrics of the specified test results and will show the comparison report:
For each selected metric, the comparison report shows a table with the metric values and a chart that shows how the metric changes throughout test runs.
Click  Print to print the comparison report. Click
  Export to PDF to export the report to a PDF file.
Click  Page Width to zoom in or out the comparison report so that its width fits the LoadComplete window. Click
  Whole Page to zoom in or out the comparison report so that its whole page fits the LoadComplete window. Click
  Zoom Default to restore the default zoom level.


