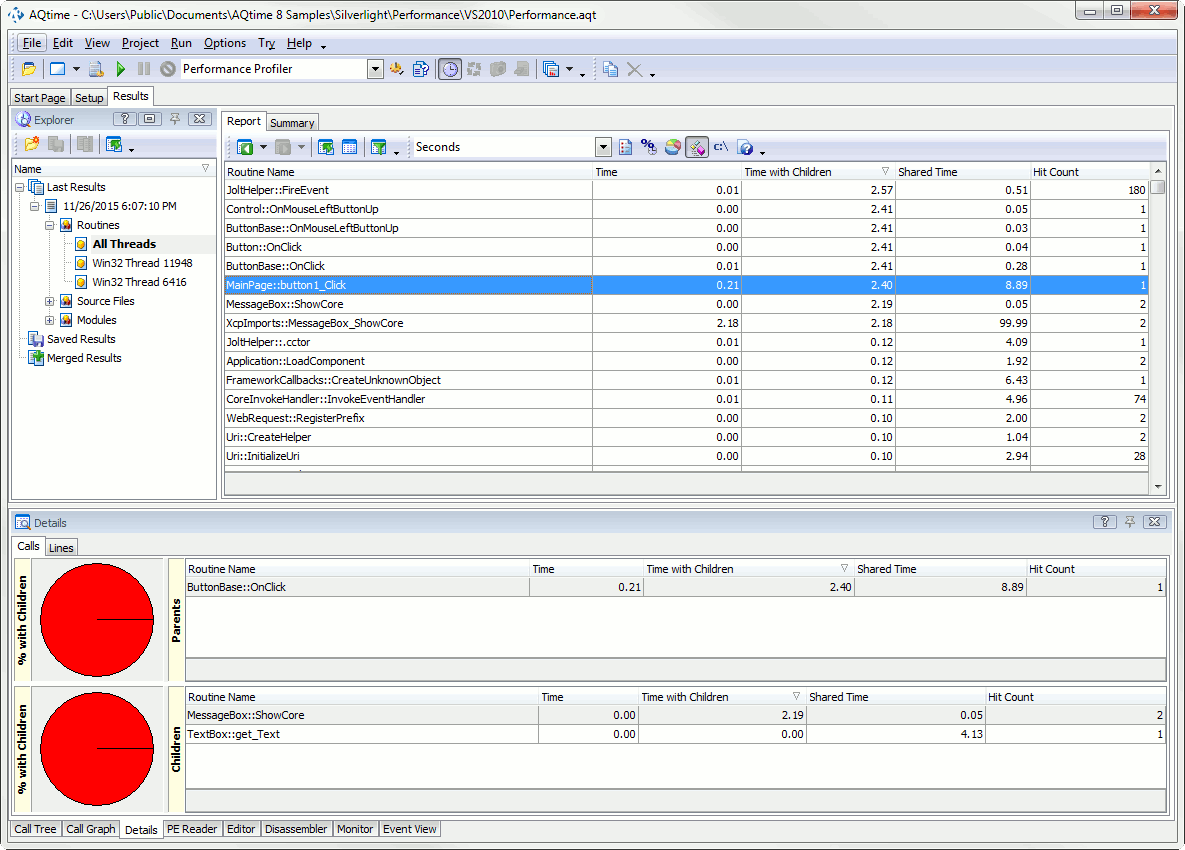
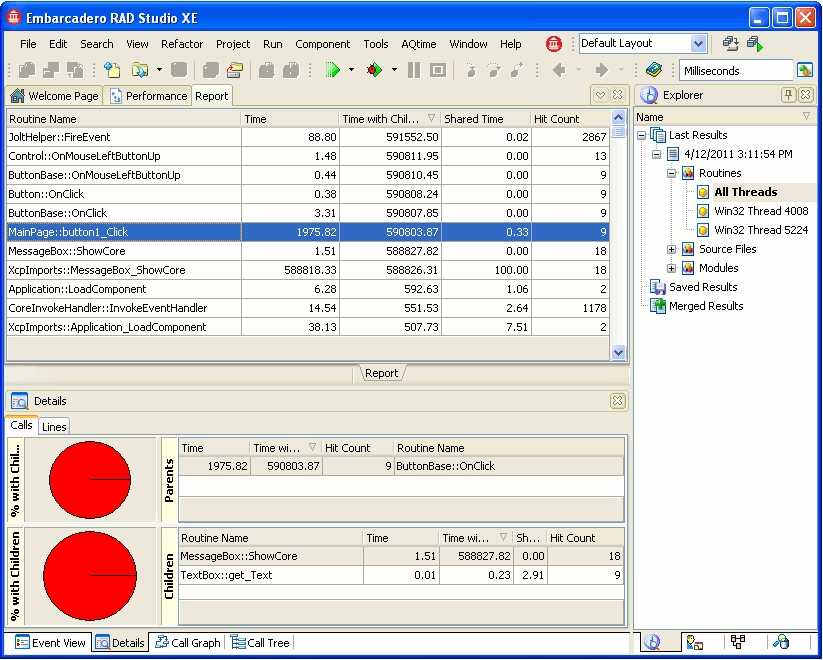
As we have enabled the Entire .NET Code area, AQTime will profile not only the application routines, but also other .NET routines that are called during the application run. So, AQTime will report the profiling results of the Silverlight application along with the results of .NET code profiling:
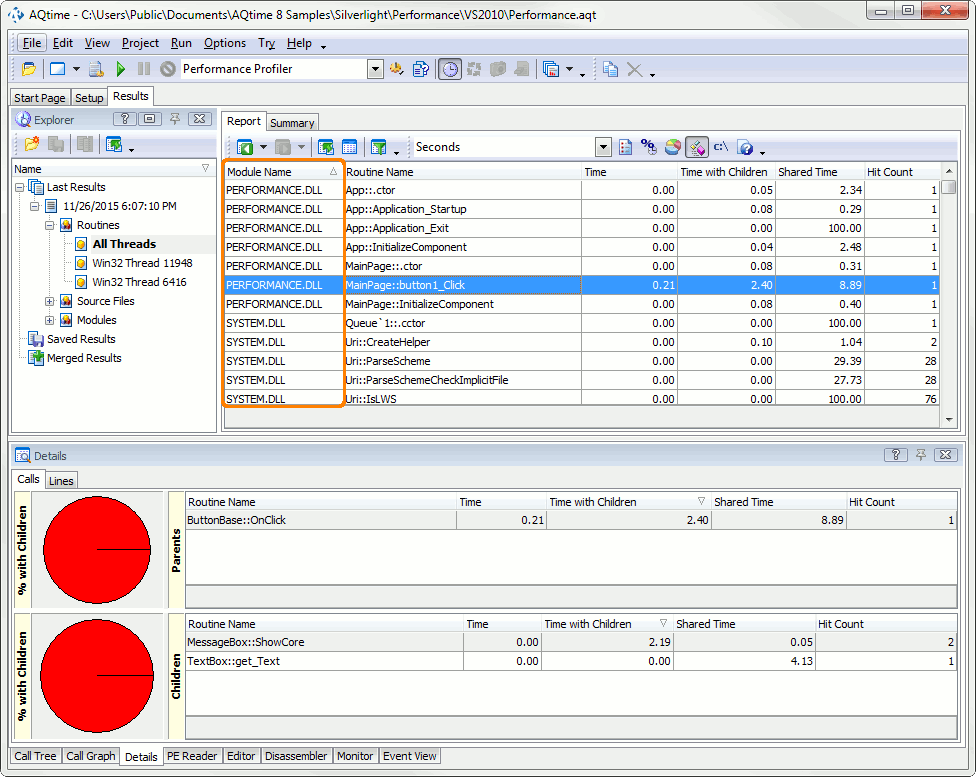
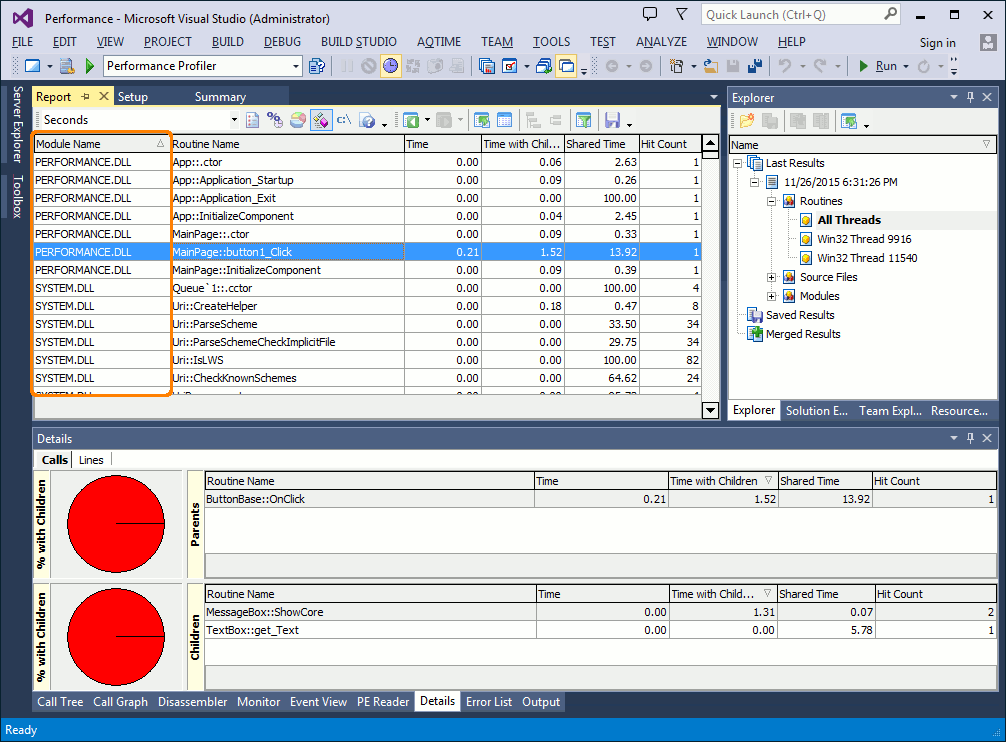
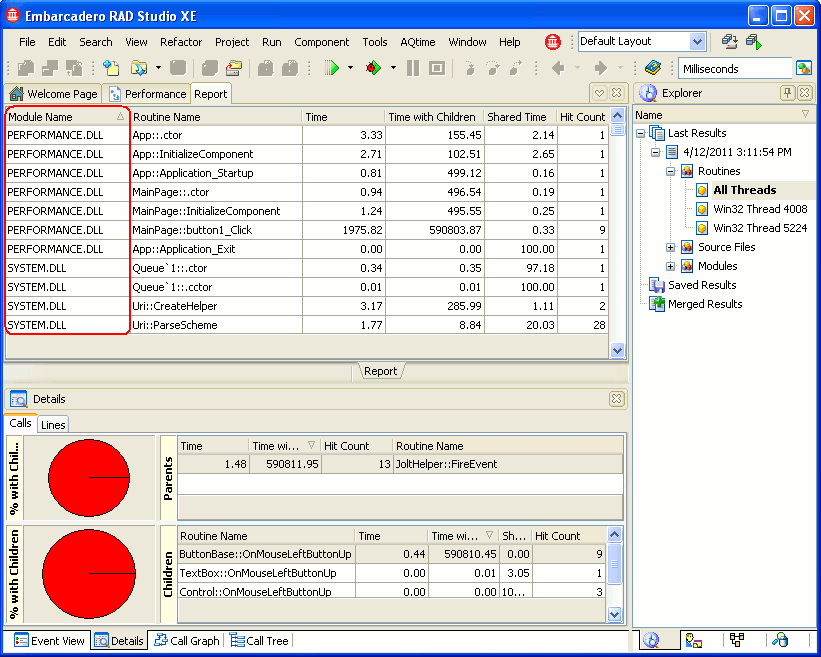
To distinguish among the Silverlight application’s routines and other .NET routines in the Report panel, use the Module Name column(see Adding and Removing Columns).
By default, the Module Name column is hidden. To add it to the Report panel, right-click within the panel and choose  Field Chooser. The Field Chooser dialog will appear:
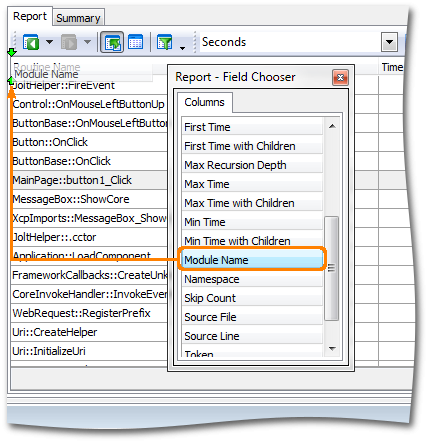
To add the Module Name column, drag it from the Field Chooser dialog to the panel.
The Module Name column specifies the name of the module which contains the profiled routine. For the routines of the Silverlight application, this column displays the name of the profiled application module. In our case, it is PERFORMANCE.DLL.
Let’s filter the results to display only the sample application routines:
- Select
 Filter from the Report context menu. This will open the Filter Dialog.
 - Use the dialog to create the following filter condition:
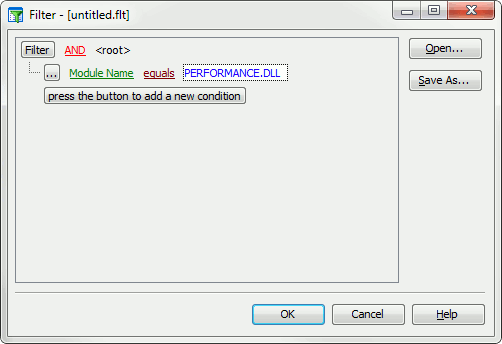
- Click OK to apply the filter.
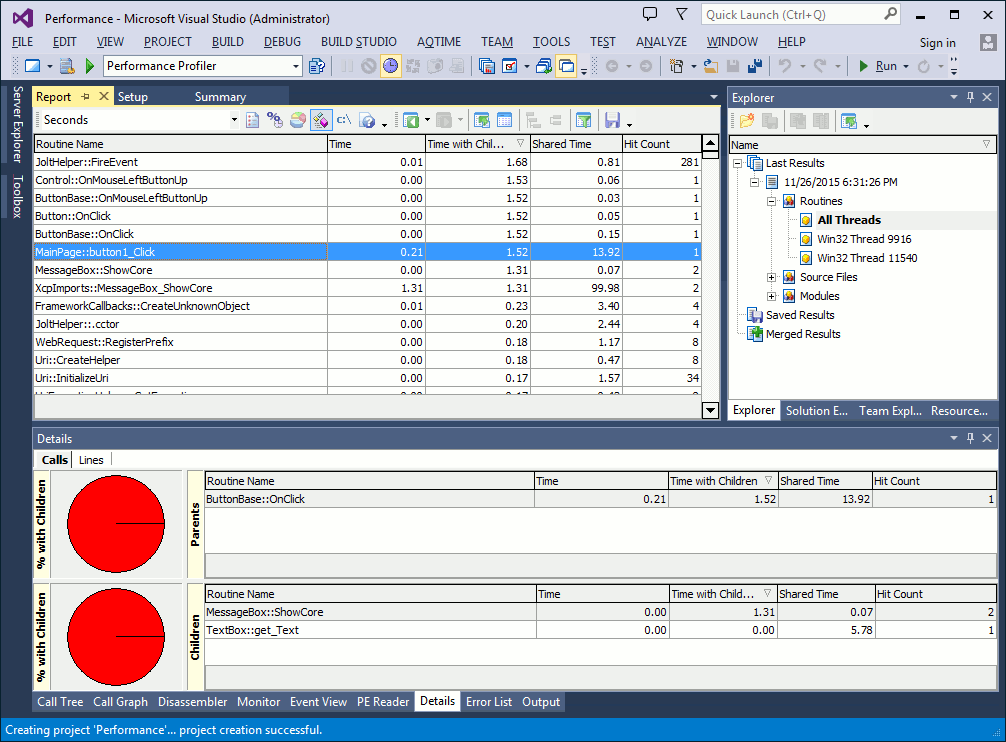
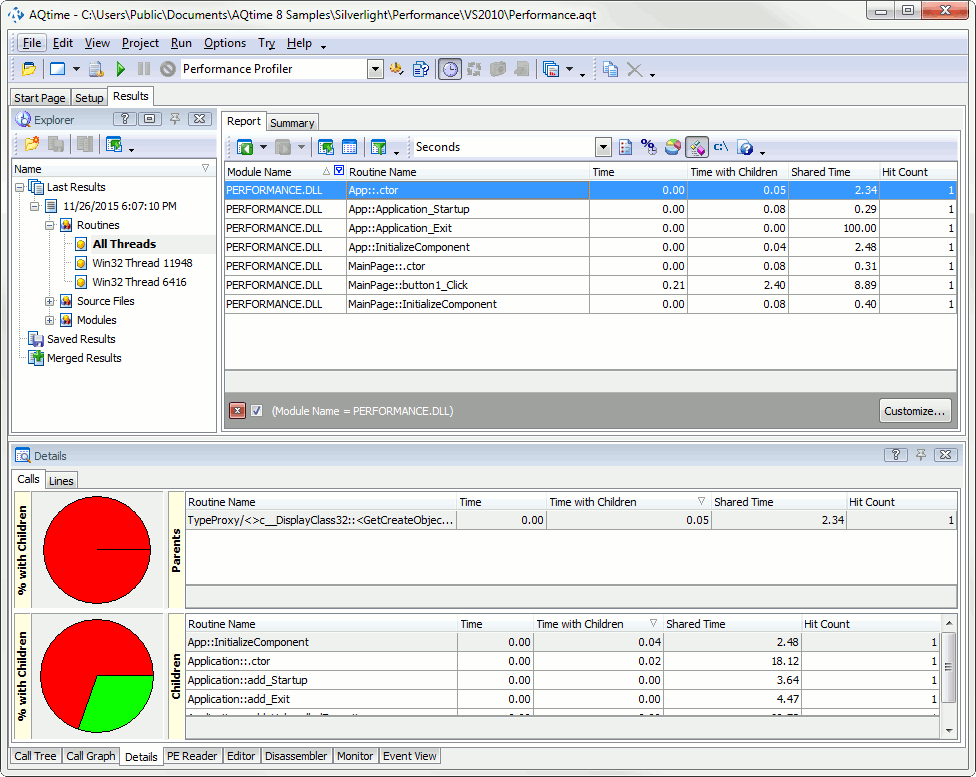
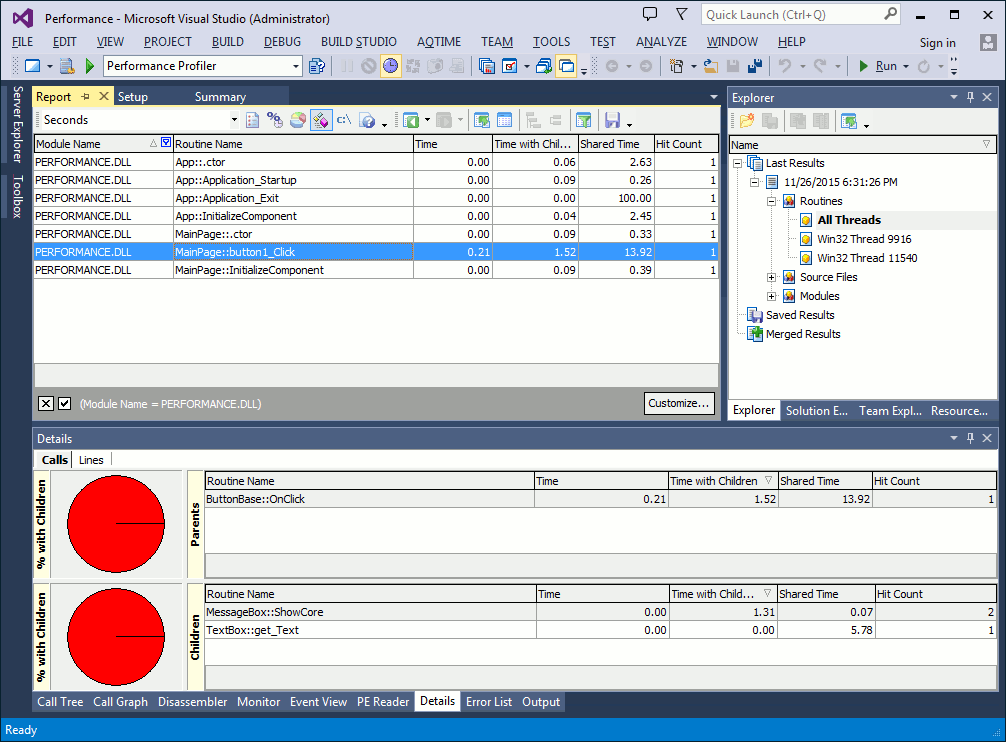
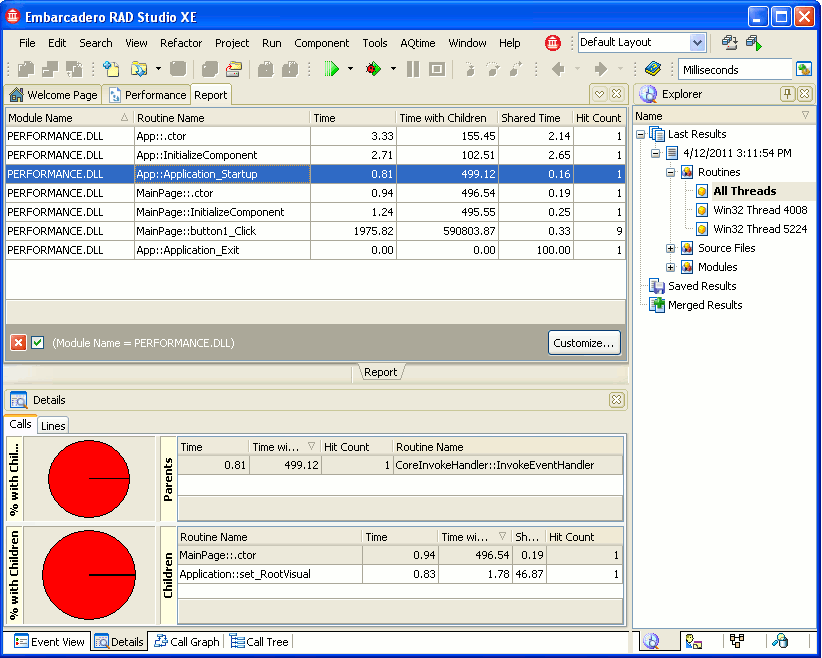
Now, the Report panel displays profiling results only for our Silverlight application:
Now, you can work with these results in the usual manner.
See Also
Profiling Silverlight Applications
Analyzing Profiler Results
Filtering Results
Adding and Removing Columns

 Prev
Prev