
To demonstrate how to profile in-browser Silverlight applications running on a local machine, we will use a sample Silverlight application, Performance, which gets installed along with AQTime. You can find it in the following folder:
 <AQTime Samples>\Silverlight\Performance\VS2010 - Visual Studio 2010 project
| Note: | The Visual Studio 2010 sample can also be opened and compiled in Visual Studio 2012 - 2017. |
 |
On Windows Vista and later, AQTime samples are located in the <Users>\Public\Documents\AQTime 8 Samples folder. On other operating systems, the samples reside in the <Documents and Settings>\All Users\Documents\AQTime 8 Samples folder. |
To profile this sample with AQTime, follow the steps below:
-
Add the sample application’s dll to the AQTime project. To do this, select
 Add Module from the context menu of the Setup panel and load the Performance.dll file (<AQTime Samples>\Silverlight\Performance\VS2010\bin\Debug\Performance.dll) in AQTime.
 -
Choose the elements to be profiled. In our tutorial, we will profile all the application routines as well as the CLR routines that are called from our application. For this purpose, enable Entire .NET Code (Routines only) in the Code to Profile pane of the Setup panel.
-
Select
 Normal from the Profiling Mode drop-down list box displayed on AQTime’s Standard toolbar.
Select
Normal from the Profiling Mode drop-down list box displayed on Visual Studio’s AQTime toolbar.Click the
Normal button on RAD Studio’s AQTime Profiling Modes toolbar. -
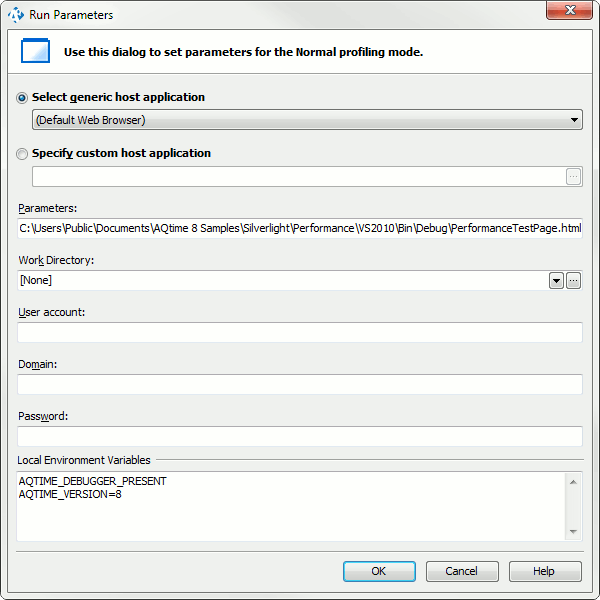
Choose Run > Parameters from AQTime’s main menu.Choose AQTime > Parameters from Visual Studio’s main menu.Choose AQTime > Parameters from RAD Studio’s menu. This will invoke the Run Parameters dialog.
-
Either select the web browser you will use to launch the application during profiling from the Select generic host application drop-down list, or specify the executable file of the web browser in the Specify custom host application edit box.
Note: Keep in mind that Silverlight applications do not work in 64-bit browsers. -
In the Parameters edit box, specify the path to the HTML file that is generated with the sample application. (<AQTime Samples>\Silverlight\Performance\VS2010\bin\Debug\PerformanceTestPage.html)
-
Click OK to save the changes and close the Run Parameters dialog.
-
Select Performance Profiler from the Standard toolbar.
Select Performance Profiler from the Profiler drop-down list in the AQTime menu.
Select Performance Profiler from the Current Profiler submenu in the AQTime menu.
-
Verify that the
 Enable/Disable Profiling button is clicked since AQTime only profiles when enabled.
 -
Click
 Run on the Standard toolbar to start the profiling.Select AQTime > Run from Visual Studio’s menu to start the profiling. An alternative way to start the profiling is to click Visual Studio’s
  Run button while any of AQTime panels is active.Select AQTime > Run With Profiling from Embarcadero RAD Studio’s menu to start the profiling. AQTime will launch your web browser and open the sample application in it.
 -
In the application, enter 10 and then click Execute. Click OK in the ensuing message box to make the application start performing actions.
-
Once the application finishes executing, click OK in the Finish message box. After that, close the application and review the profiling results.
 Prev
Prev