In the previous step, we have found out that the get_SqrMod function may be the cause of the bottleneck. To understand what can cause the bottleneck, let's explore the get_SqrMod function and its parent functions DoEvalComplex and Evaluate in detail. For this purpose, let's profile each of the functions at line level. This will let us see how each line of their code performs.
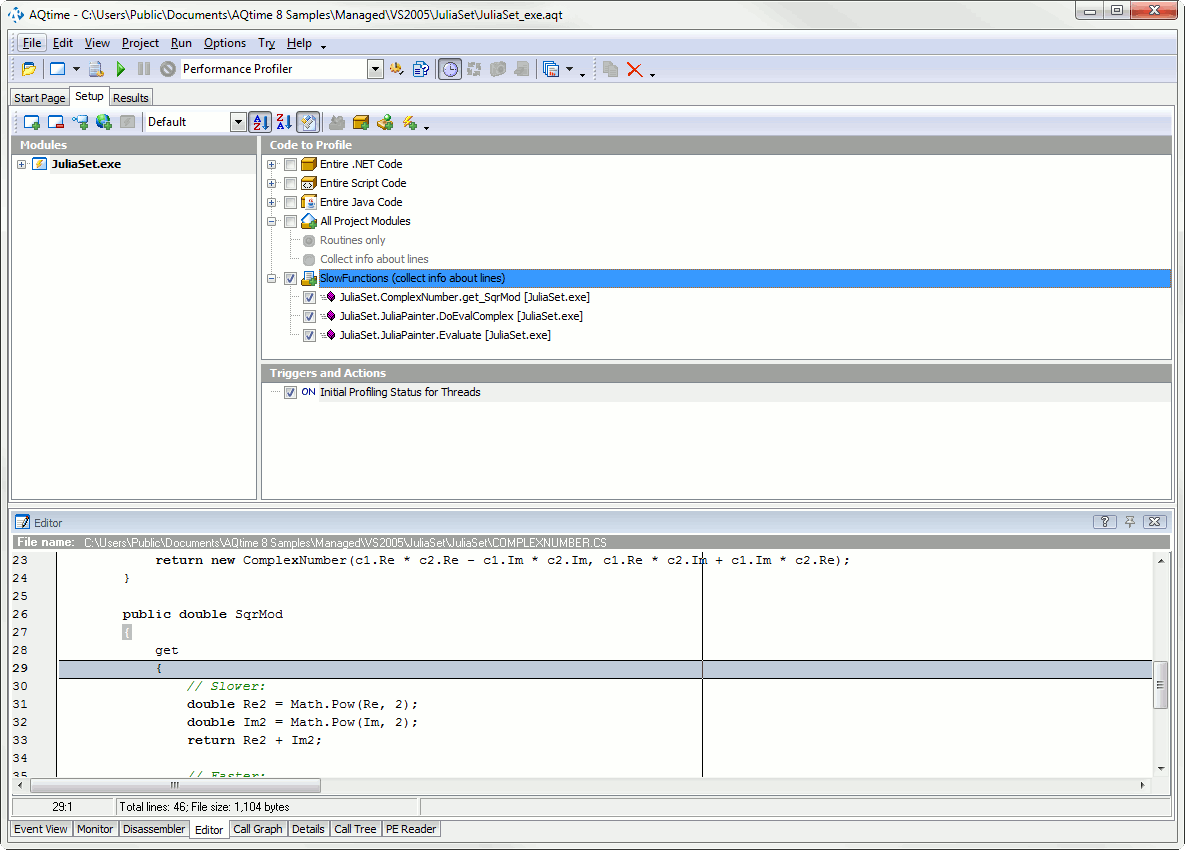
To profile the functions by lines, add them to a line-level profiling area:
- Select the
Evaluate,DoEvalComplexandget_SqrModfunctions in the Report panel. - Right-click the selection and choose Add Selected to Setup > Add to New Profiling Area from the context menu. The Add Profiling Area dialog will appear.
- In the dialog:
- In the Name field, specify the area's name.
- Make sure that the Collect info about lines check box is selected.
- Click OK.
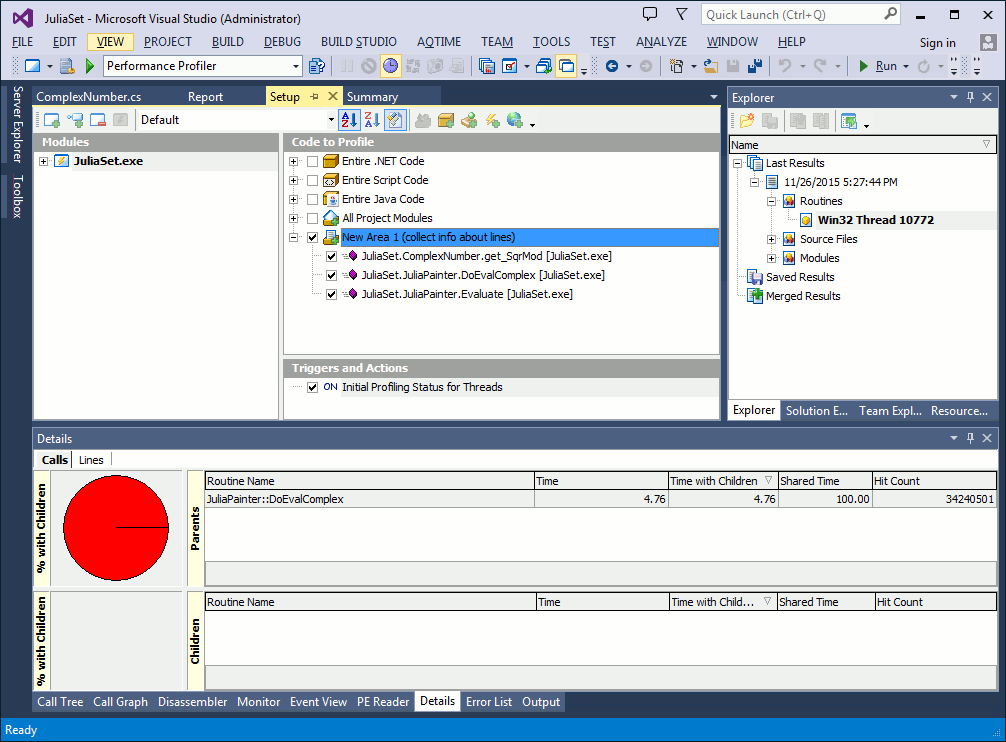
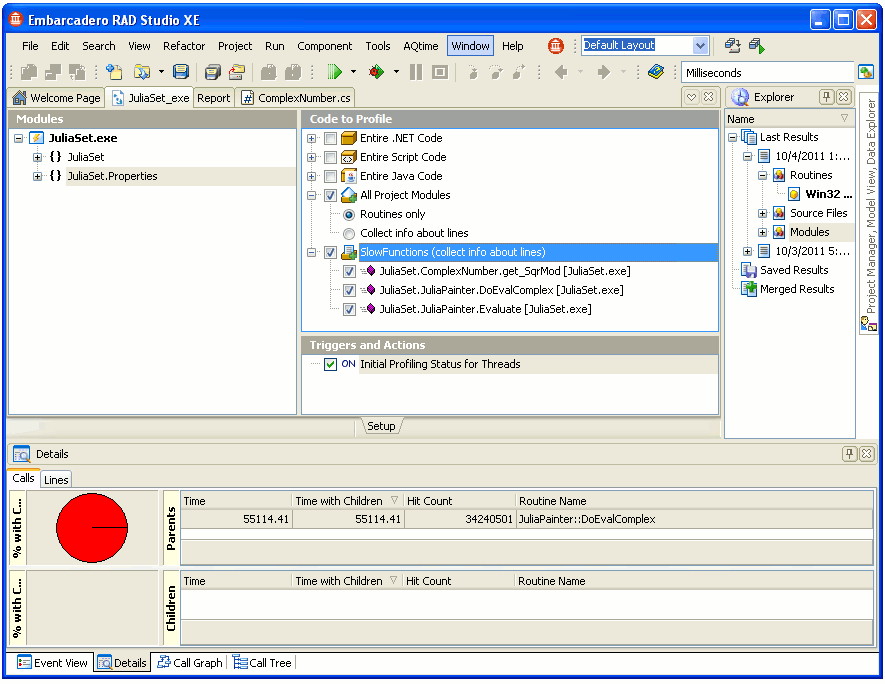
AQTime will create a new line-level profiling area and add the functions to it.
In order for AQTime to profile only the functions added to this area in the next profiler run, make sure that the area is enabled in the Setup panel and disable the All Project Modules area.
Now let's run profiling once again. To do this, click the Run button on the toolbar. AQTime will display the run settings, keep them default and click the Run button. In the application, click Draw. After the fractal has been drawn, close down the application. AQTime will generate profiling results.
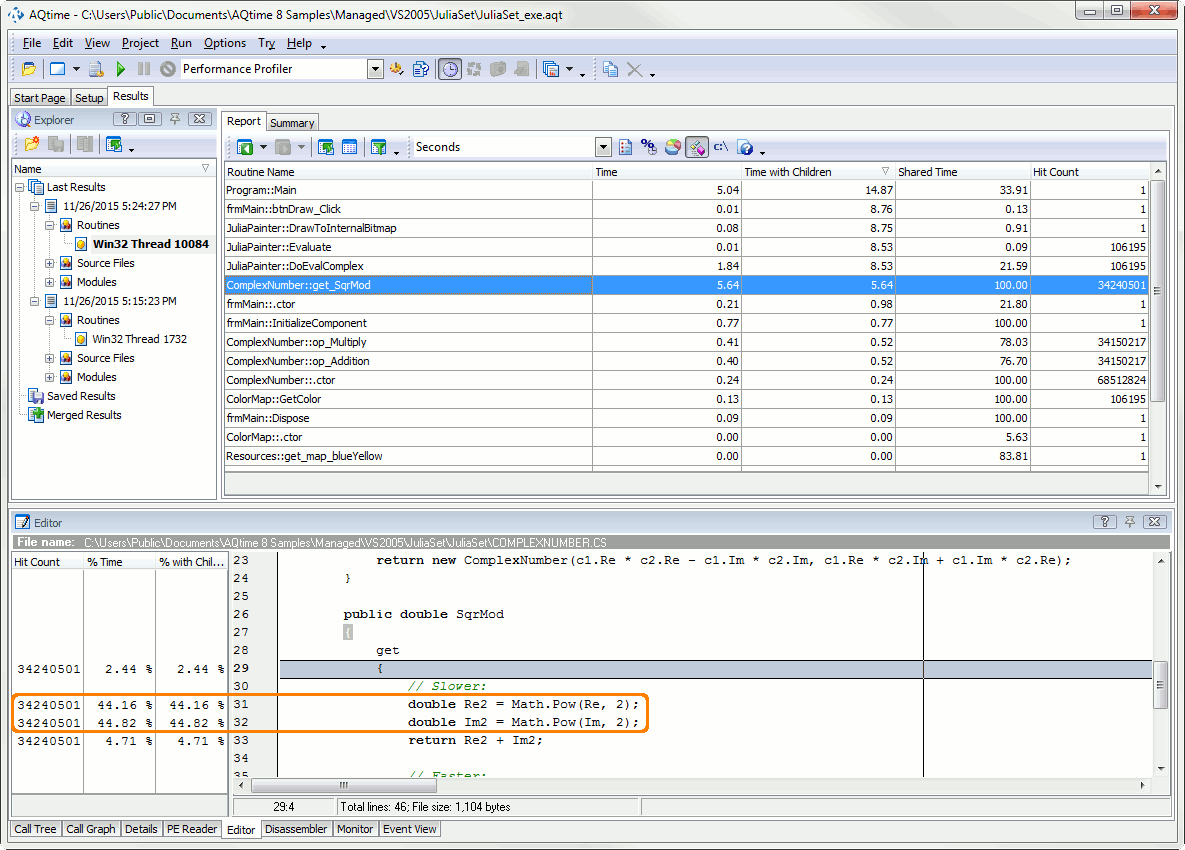
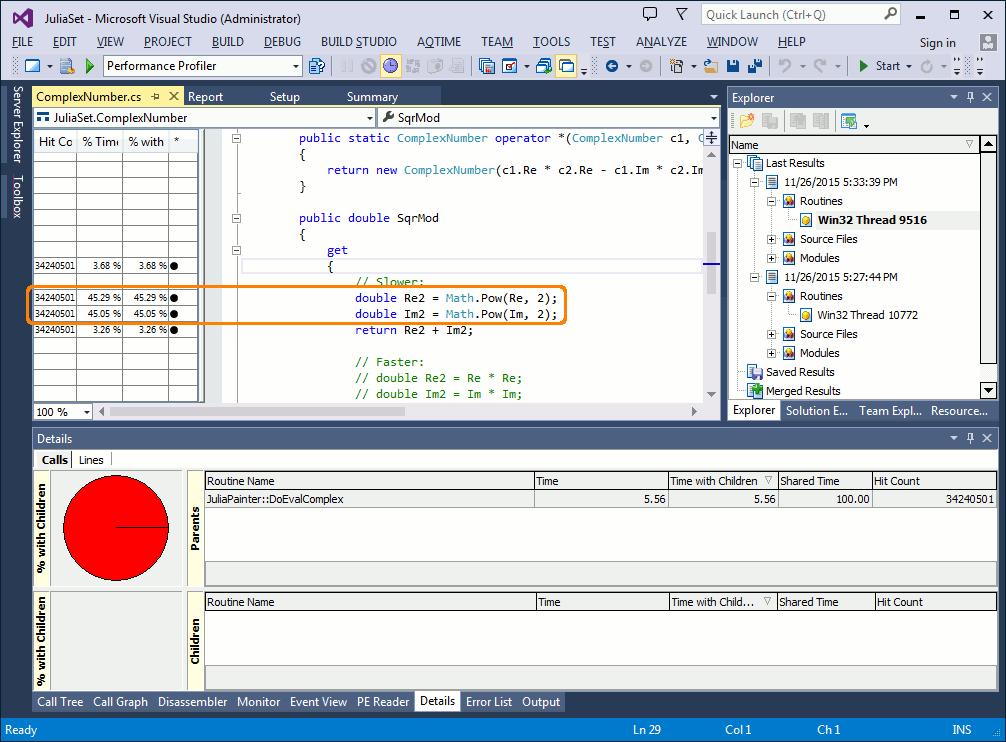
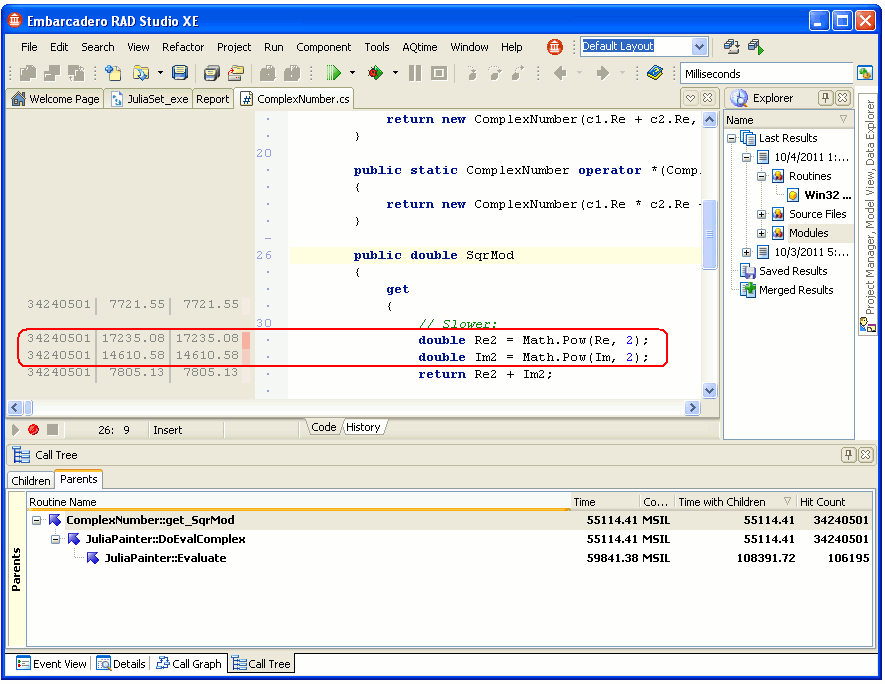
Let’s see how the get_SqrMod function performed. To review the problem function’s source code, select the function in the Report panel and switch to the Editor panel.To review the problem function’s source code, double-click the function in the Report panel. The source code will be displayed in the Code Editor.To review the problem function’s source code, double-click the function in the Report panel. The source code will be displayed in Embarcadero RAD Studio’s native text and code editor.
On the left side of the Editor panelof the Code Editorof the code editor, you can see profiling results for each line of the function. As you can see, most of the execution time is taken by two calls to the Pow method.
So, the get_SqrMod function needs optimizing since it seriously affects the overall performance of the application. To fix the bottleneck, you can replace those two calls to the Pow method with simpler code:
double Im2 = Im * Im;
This will significantly improve the get_SqrMod function's performance and the overall performance of the application.

 Prev
Prev