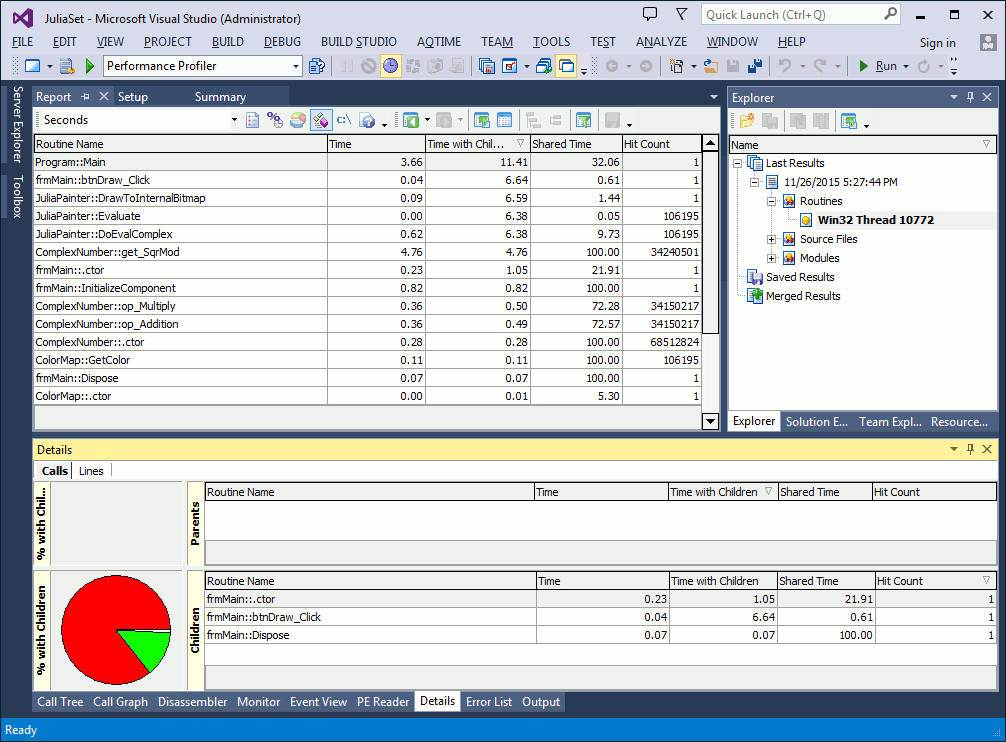
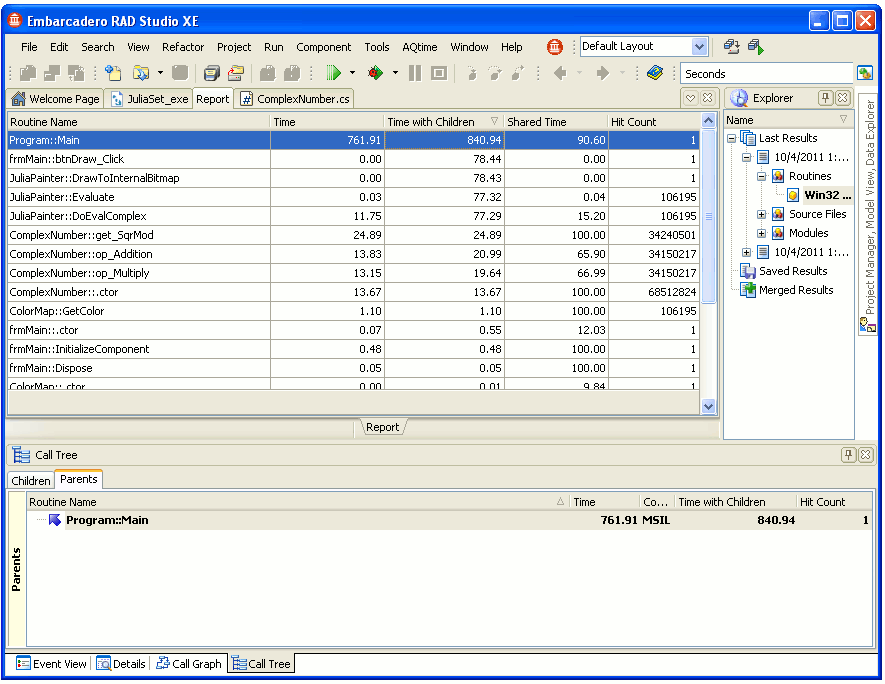
Let’s explore the profiling results and find the bottleneck. Switch to the Report panel. This panel provides information about functions that were called during the profiler run.
To find the slowest function, sort the results in the Time With Children column. This column shows the total time spent on calls to the routine, including calls to child routines. What we can see according to the data displayed in the Time with children column is that Main is the slowest routine of our application. This result is an expected one because the Main routine makes up the rest of the application.
Now let’s view the value displayed in the Time column. This column displays the execution of the routine’s body only. By comparing results in these two columns, Time and Time With Children, we can determine why it took a routine so long to be executed: a routine may be working quickly, but it can call other functions that may perform slowly and make the routine one of the slowest routines in your application.
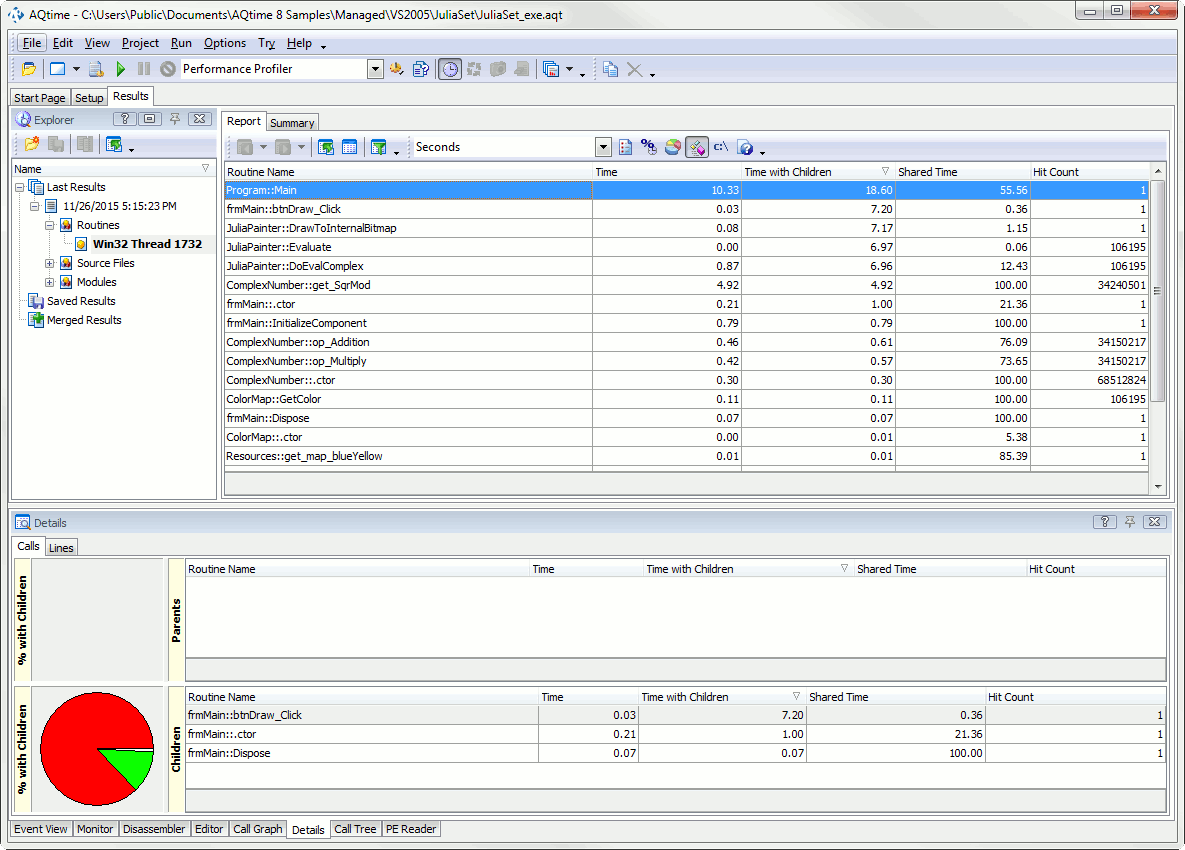
As you can see, Time is less than Time with Children. This means that the performance problem is not related to the Main function but to its child routines. Let’s explore which routines the Main routine calls. To do this, select the Main routine in the Report panel and go to the Details panel.
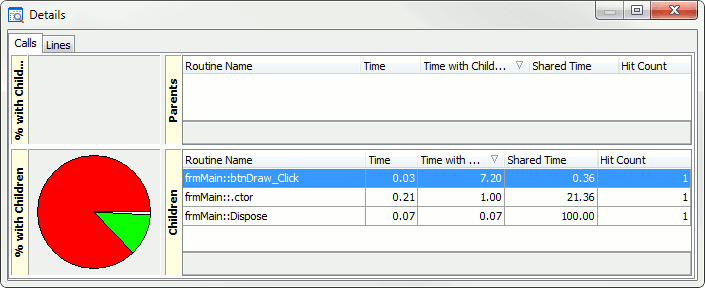
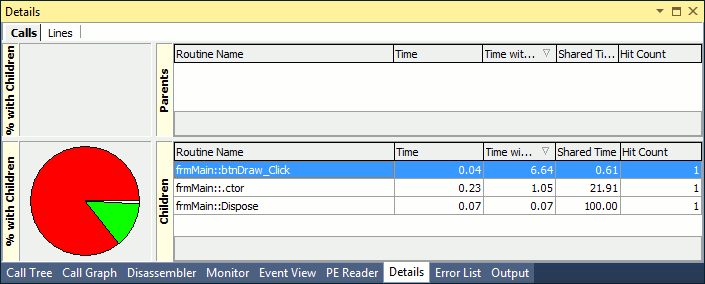
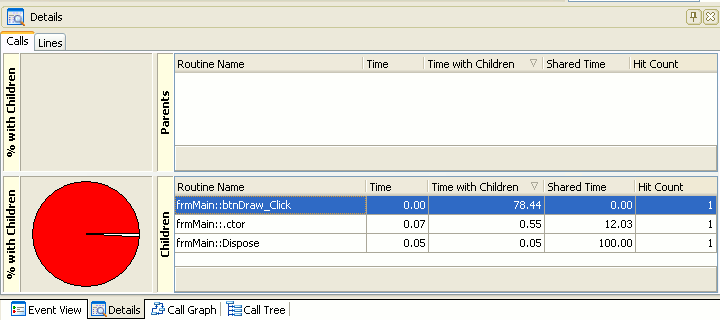
Information about parent and child routines is displayed in the Details panel. As you can see, the Main routine has several child functions and the slowest of them is btnDraw_Click. And as we can see, Time With Children of this function is much greater than the Time value. This means that this function is not a bottleneck because most bottlenecks do not take place inside a function but within its child methods.
So, to explore which child methods this routine called, double-click it in the Children table.
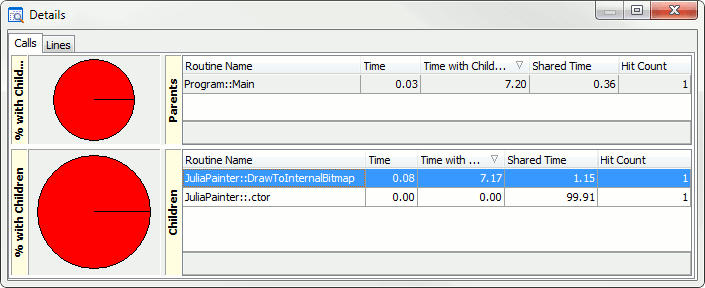
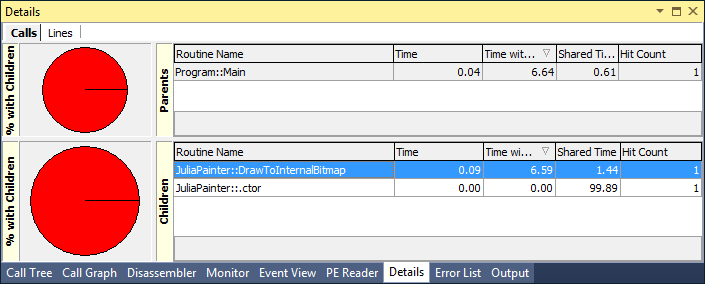
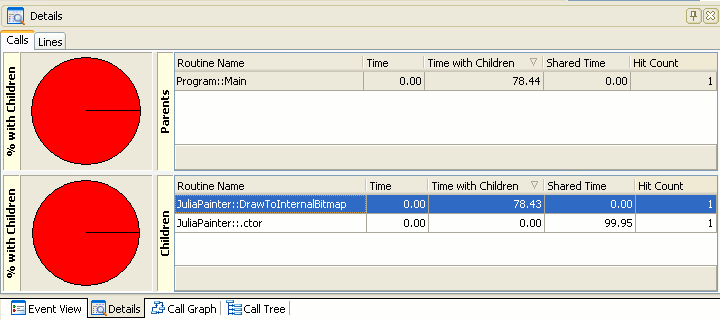
As you can see, the slowest child function of the btnDraw_Click function is DrawToInternalBitmap. If you compare its Time and Time with Children values, you can see that this function is not a bottleneck.
By performing the same analysis for the DrawToInternalBitmap function, you can see that its child Evaluate function is not a bottleneck either.
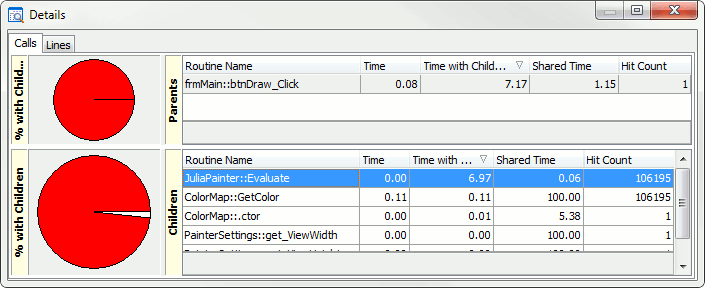
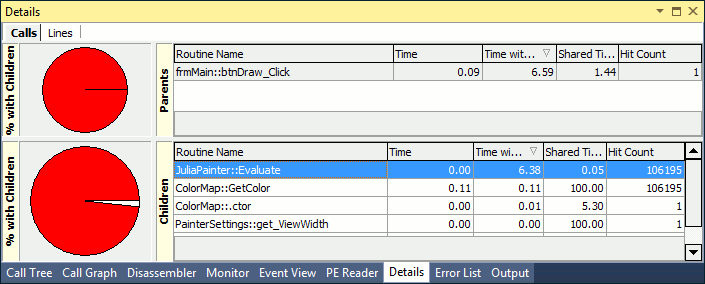
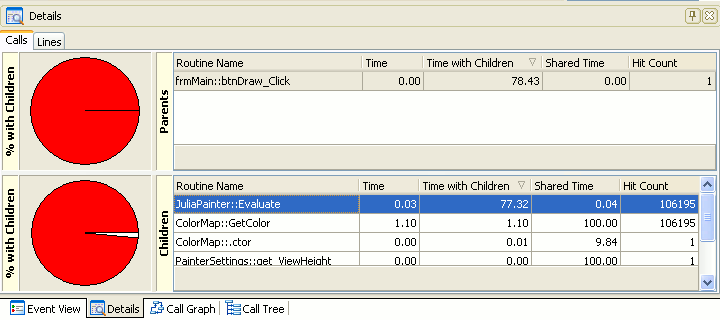
By the way, the Report panel also contains the Shared Time column. This column displays the difference between the Time and Time With Children values expressed in percentage. The column can also be displayed in the Details panel. It’s hidden by default. To view it, right-click within the Children table, select Field Chooser from the context menu and add the Shared Time column to the list of columns.
If Shared Time is close to a hundred percent, it means that the routine’s execution time was mostly taken by the routine’s body, not by child functions. If the Shared Time value is exactly 100%, it means that there are no child functions.
Let’s continue analyzing the results and explore the child functions of the Evaluate routine. To do this, double-click the Evaluate routine in the Children table.
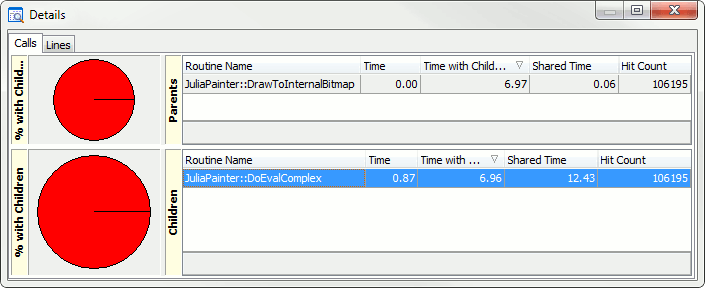
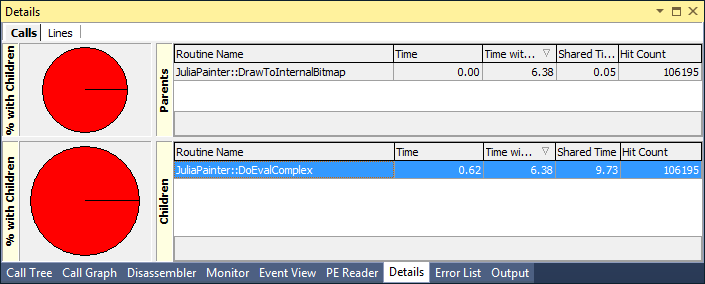
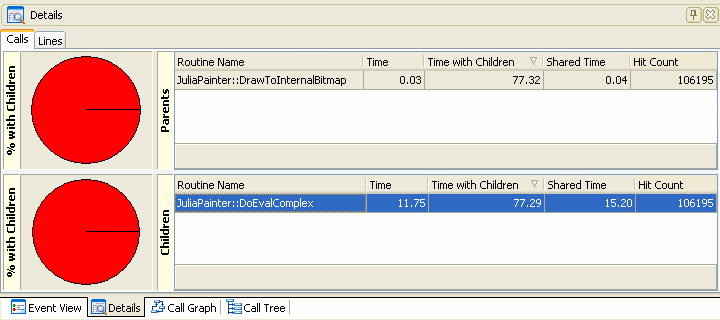
As you can see, this function contains only one child function - DoEvalComplex. Its Shared Time equals about 17%. So, we can suppose that the bottleneck can occur in the child function of the DoEvalComplex function. To check this, double-click the DoEvalComplex and go to the Details panel.
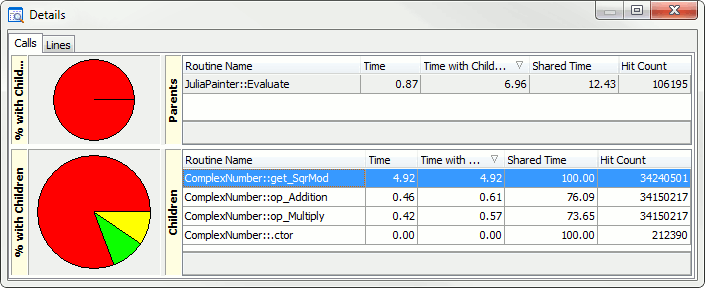
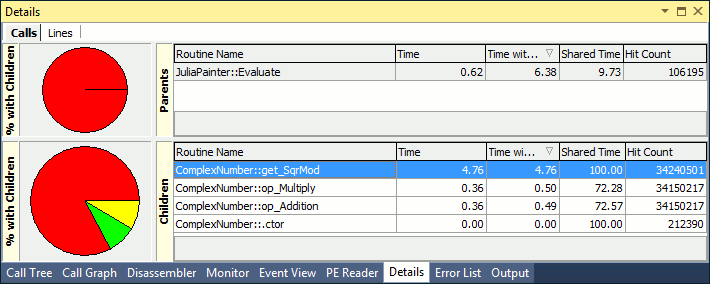
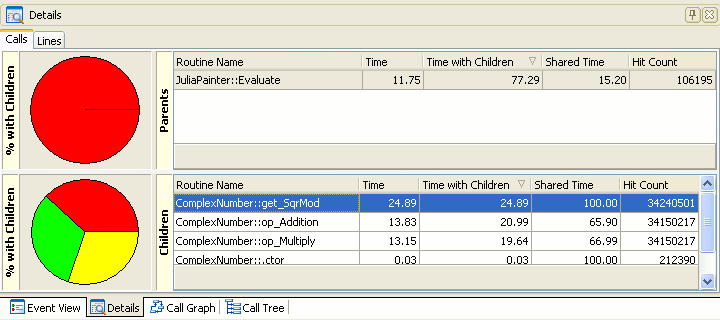
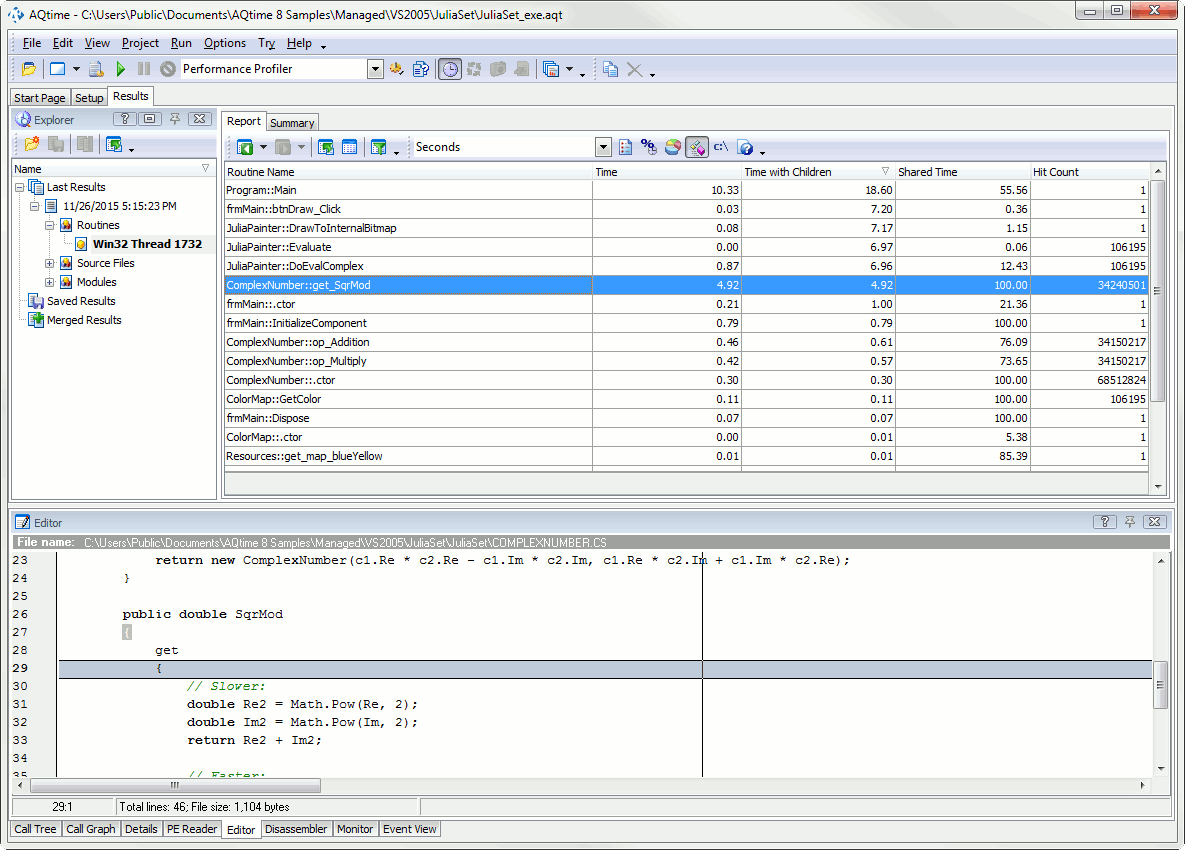
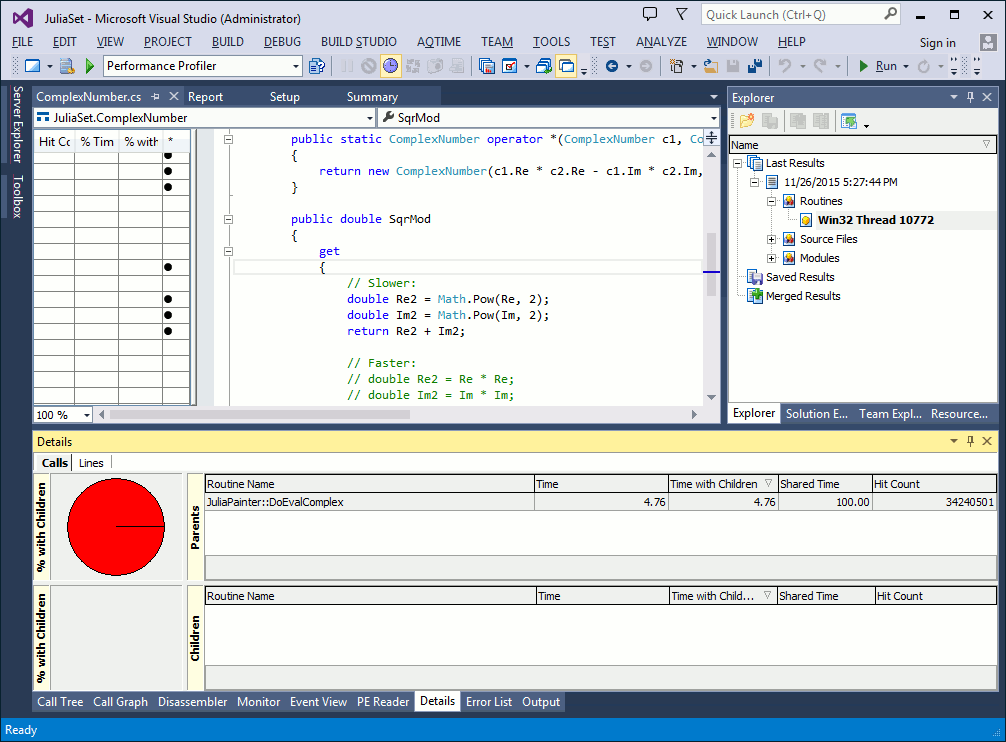
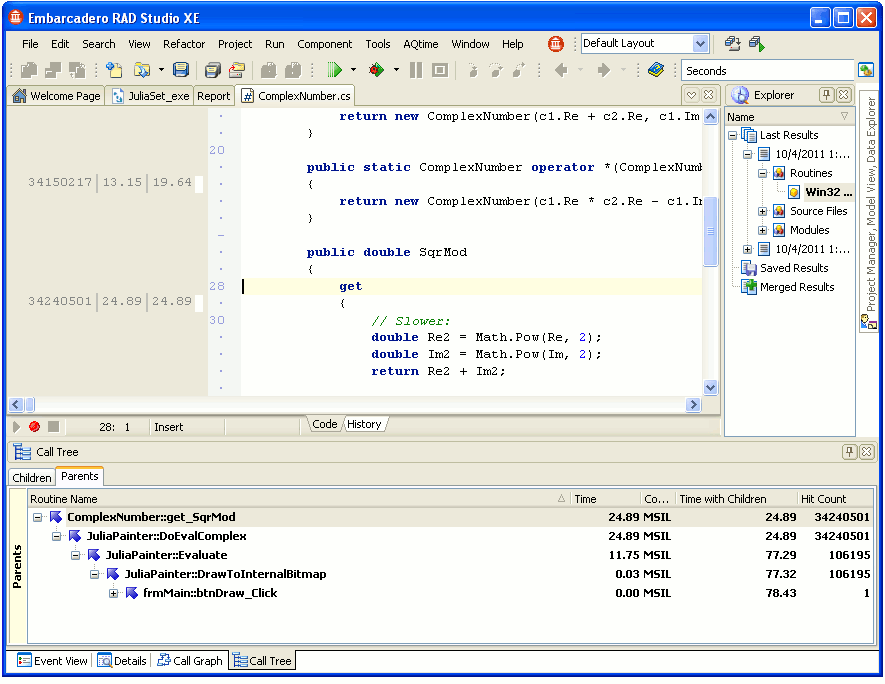
Now this panel shows that the slowest child function is the get_SqrMod function. You can see that the Hit Count column displays that this particular routine was called over 34 million times and the Shared Time value of this function is 100%. This means that the function has no child functions and, most likely, that it is the cause of the bottleneck.
To view the source code of the get_SqrMod function, select it in the Report panel and switch to the Editor panel.
To view the source code of the get_SqrMod function, double-click it in the Report panel.
To view the source code of the get_SqrMod function, double-click it in the Report panel.
As you can see, it’s difficult to determine the cause of the bottleneck at this point of time. To find it, we need to explore the get_SqrMode function and its parent functions in detail. We'll do that in the next step.

 Prev
Prev