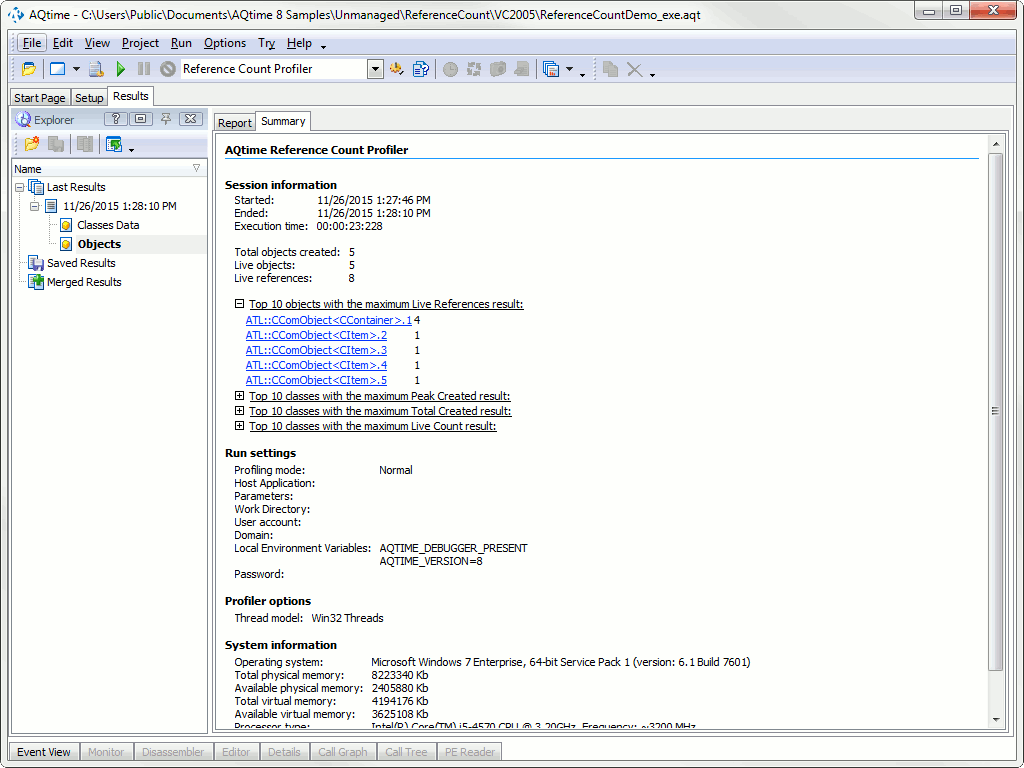
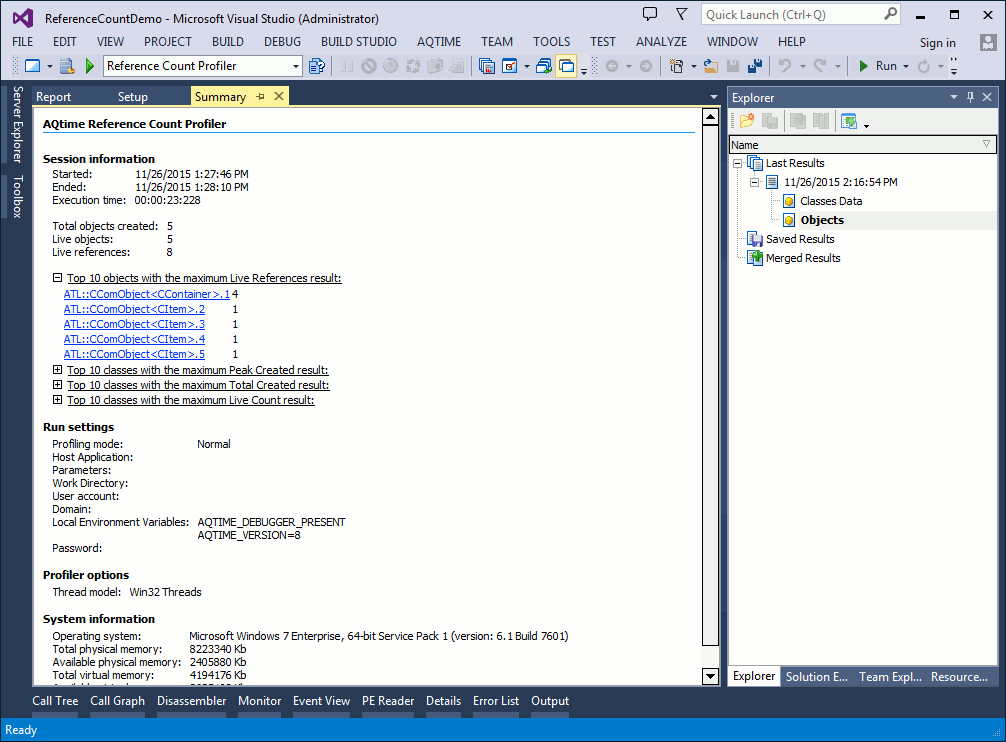
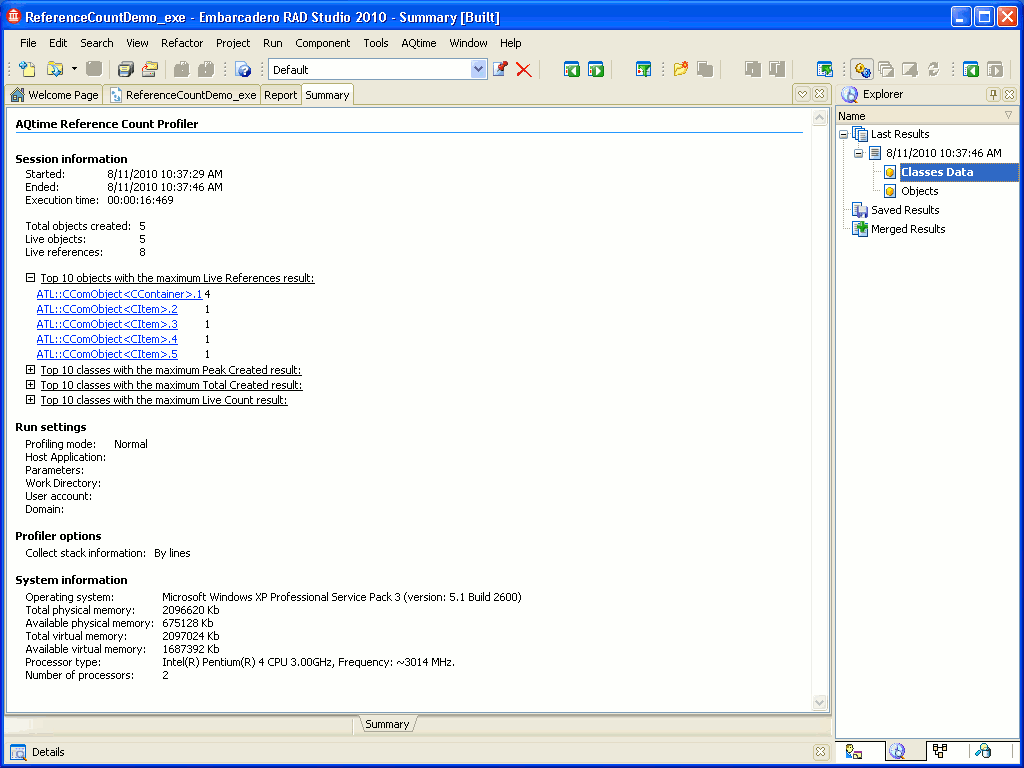
After closing the sample application, AQTime will stop profiling and generate the profiling results. The Summary panel of AQTime displays the summarized statistics for the profiler run:
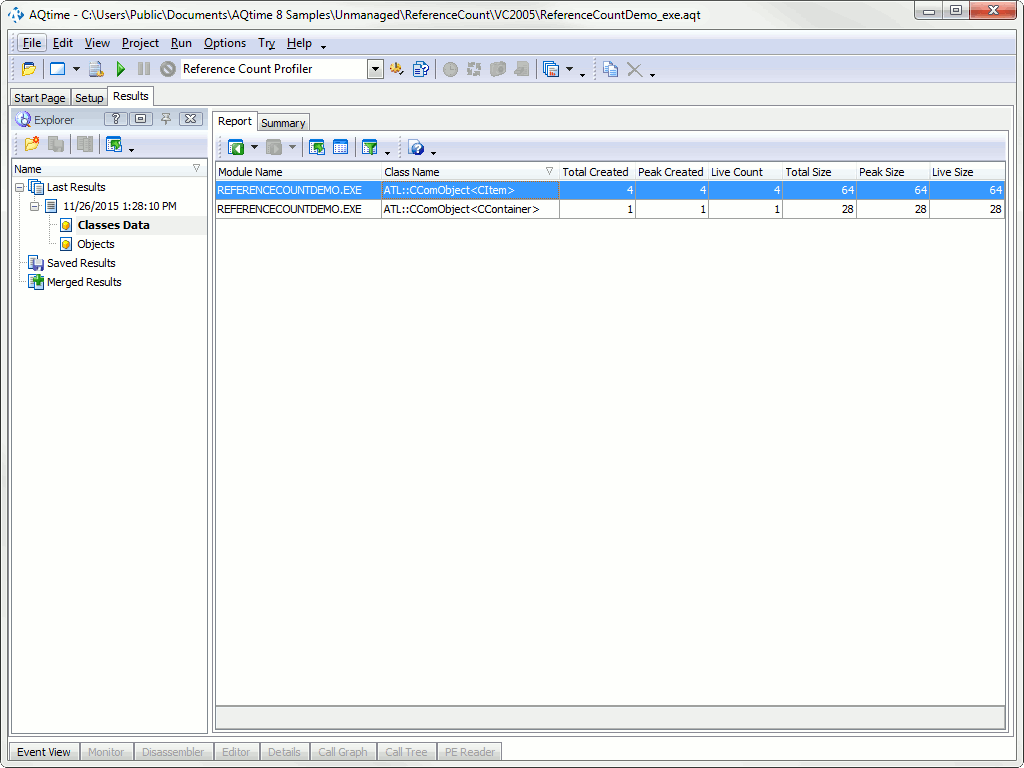
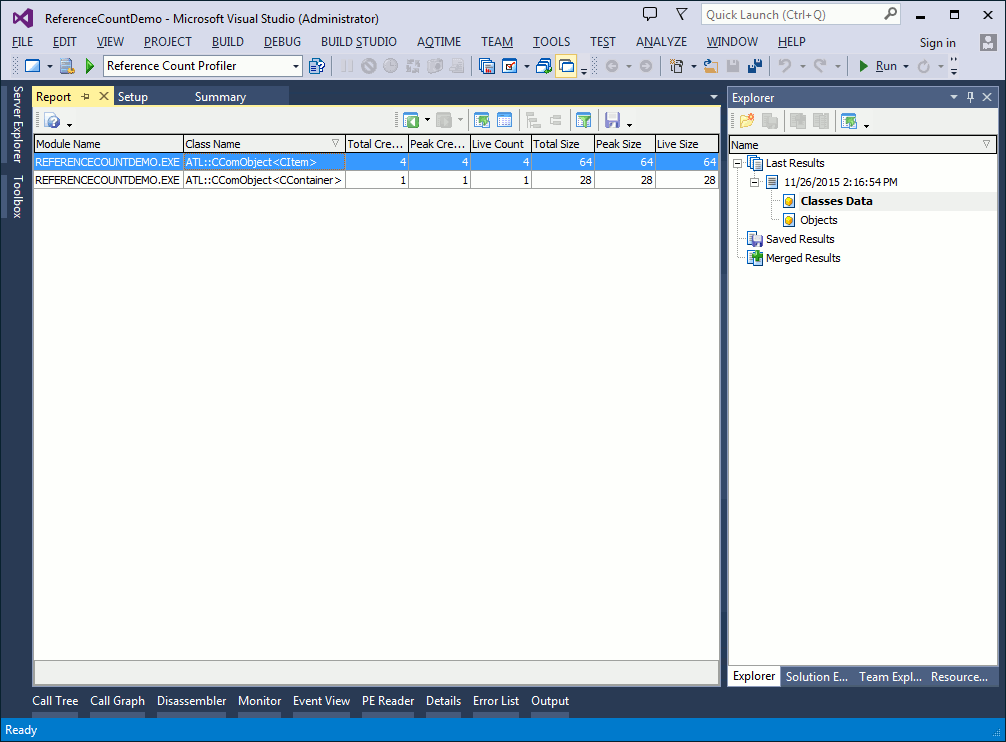
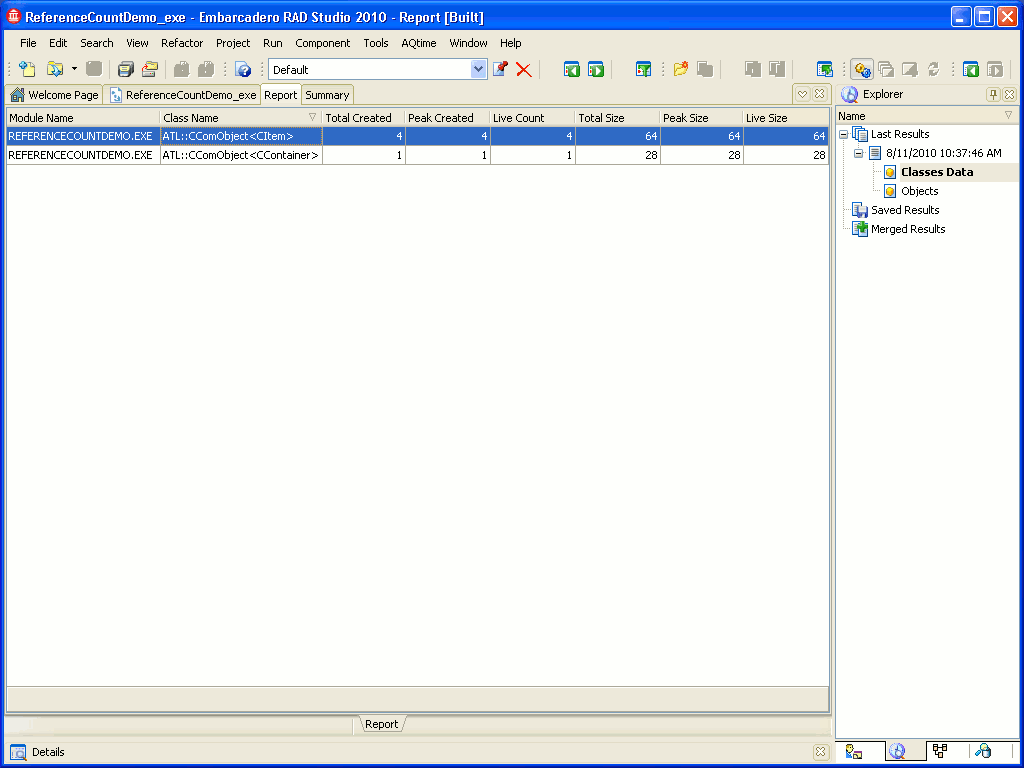
Profiling results are organized into two categories: Classes Data and Objects. The Classes Data category provides information about classes, whose instances remain in memory when the results are generated. Select the Classes Data category in the Explorer panel and look at the Report panel. It will list classes that a problematic:
If you run the Visual C++ sample, AQTime will report that the application contains two classes, whose instances were not released.If you run the Visual C++ sample, AQTime will report that the application contains two classes, whose instances were not released.If you run the Delphi sample, AQTime will report that the application contains three classes, whose instances were not released. The Live Count column for the classes shows the number of existing class instances. The Live Size column contains the size of the unreleased objects in memory.
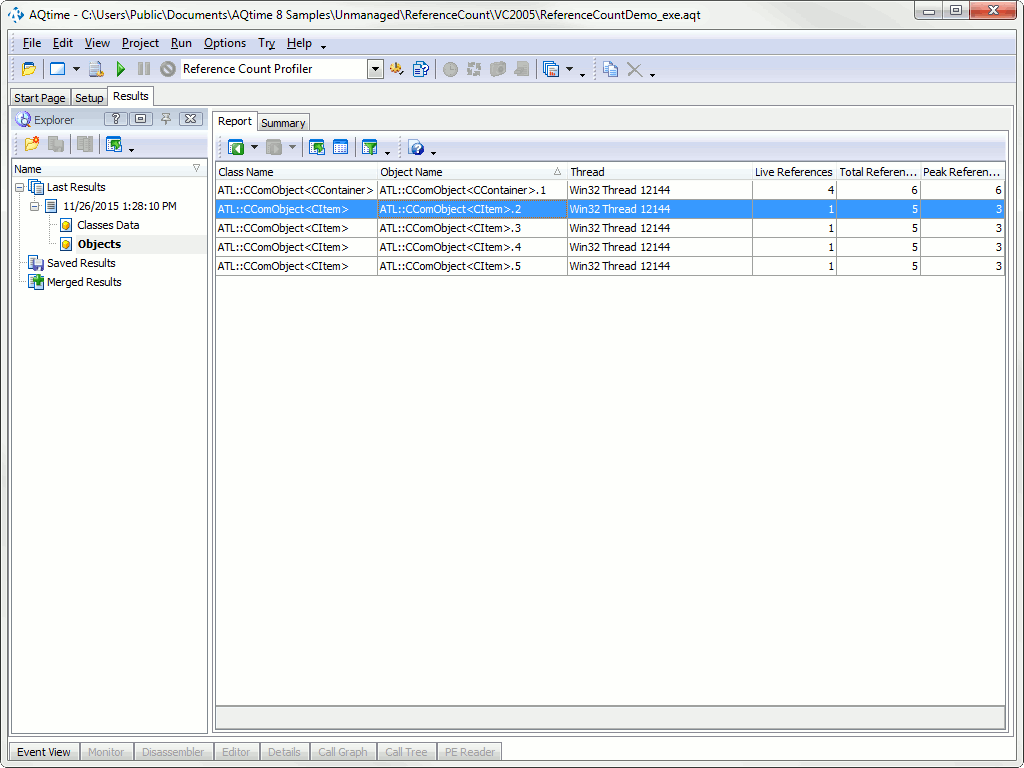
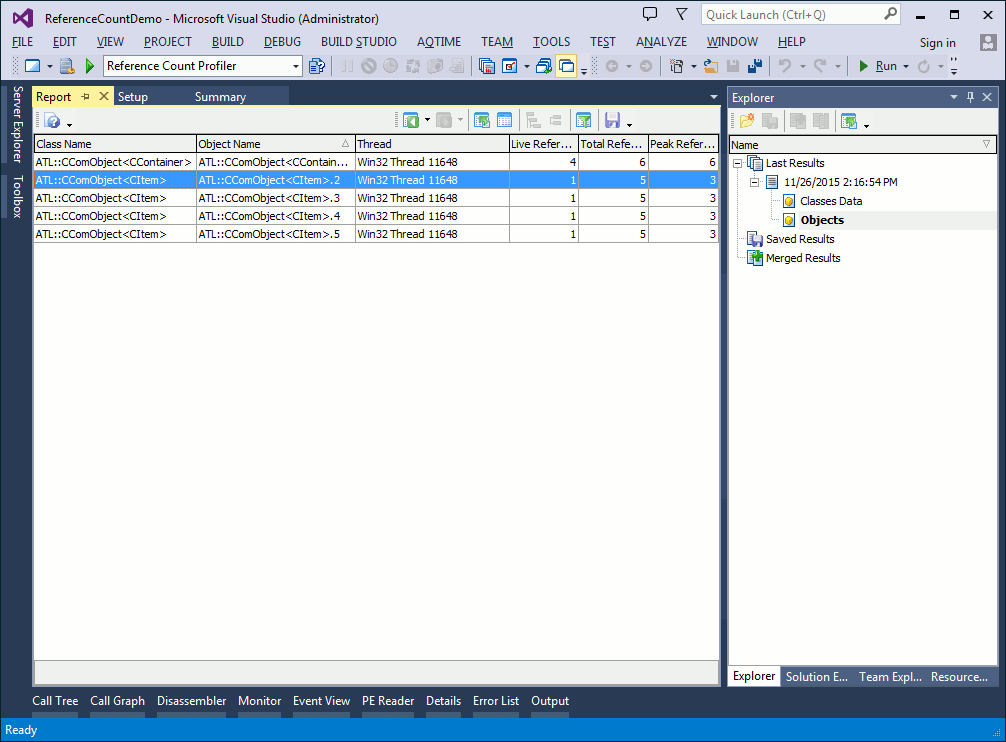
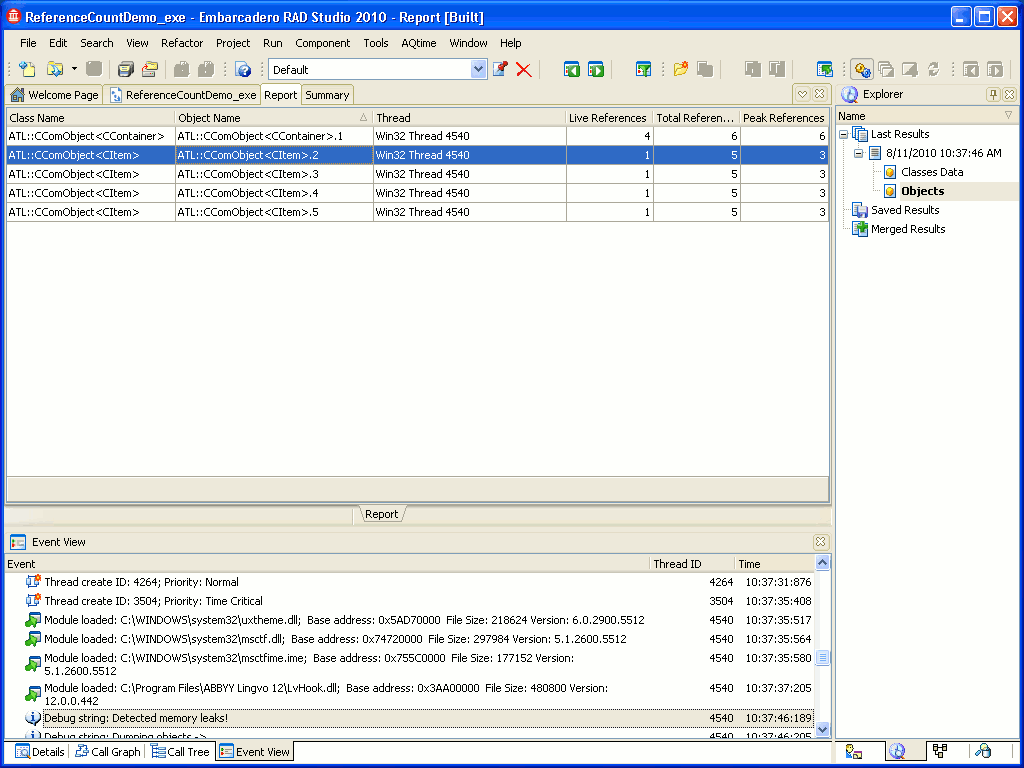
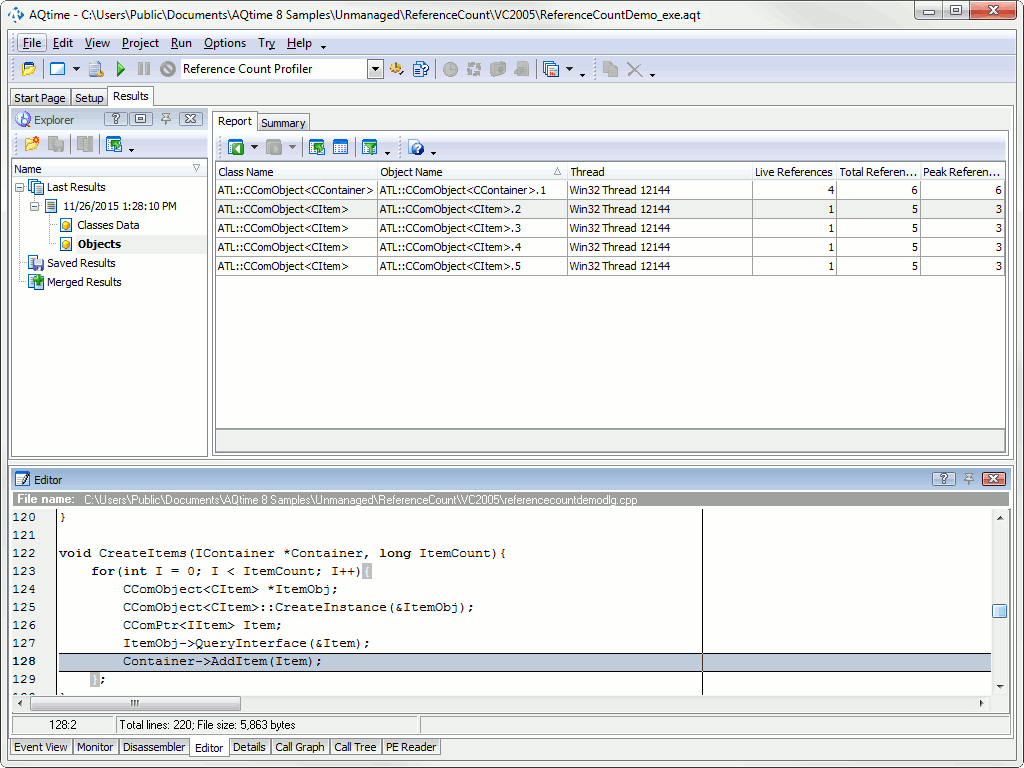
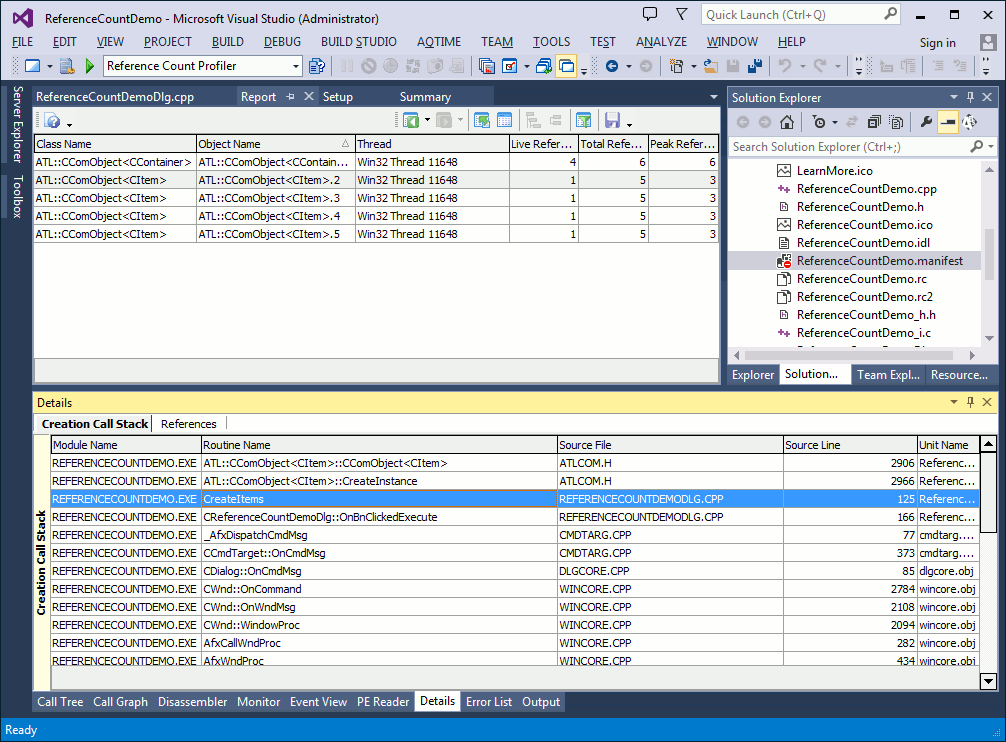
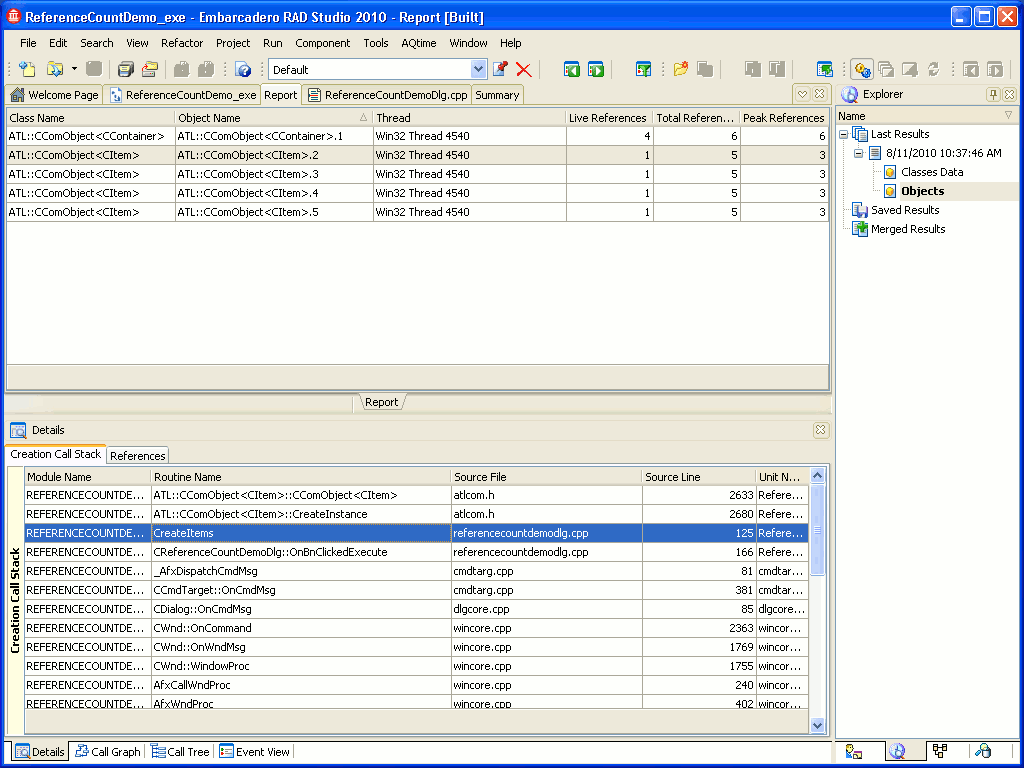
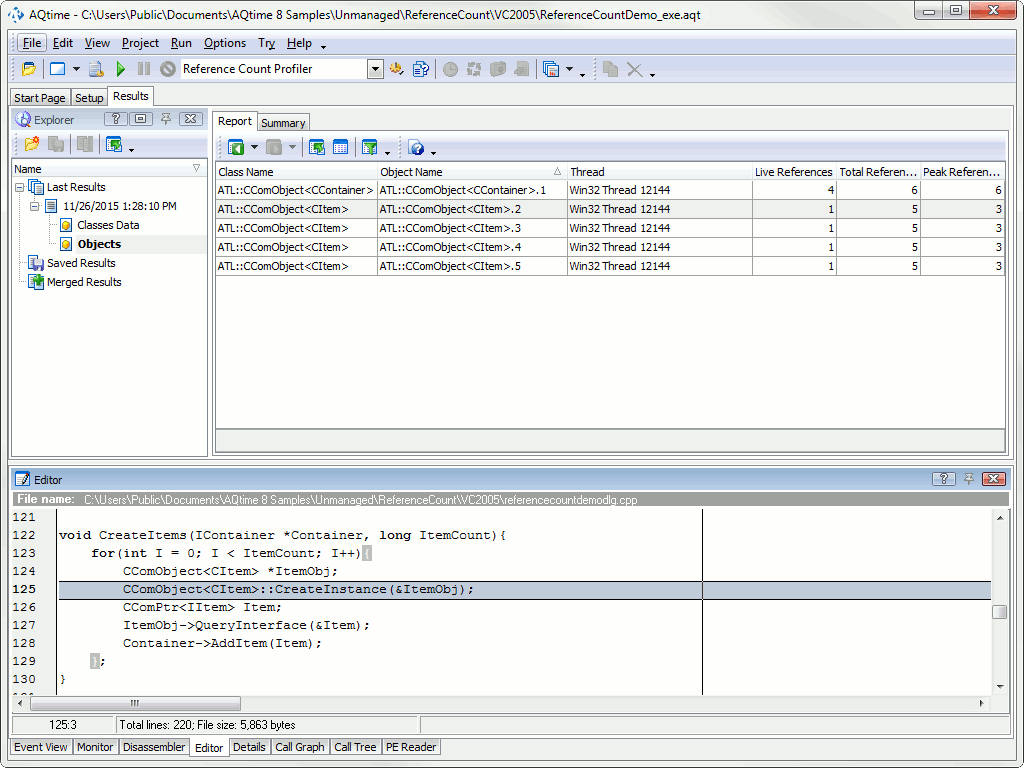
To obtain information about the unreleased objects, select the Objects category in the Explorer panel and look at the Report panel. It displays unreleased objects that were detected during profiling:
Each row in the Report panel corresponds to an unreleased object. In our example, the panel contains five rows.In our example, the panel contains five rows.In our example, the panel contains six rows. The object name consists of the class name and the creation number that is relative to other objects of the same class. The Thread column specifies the thread in which the object was created. The Live References column specifies the number of references to an object. To obtain information about these references, click the object in the Report panel and then switch to the Details panel.
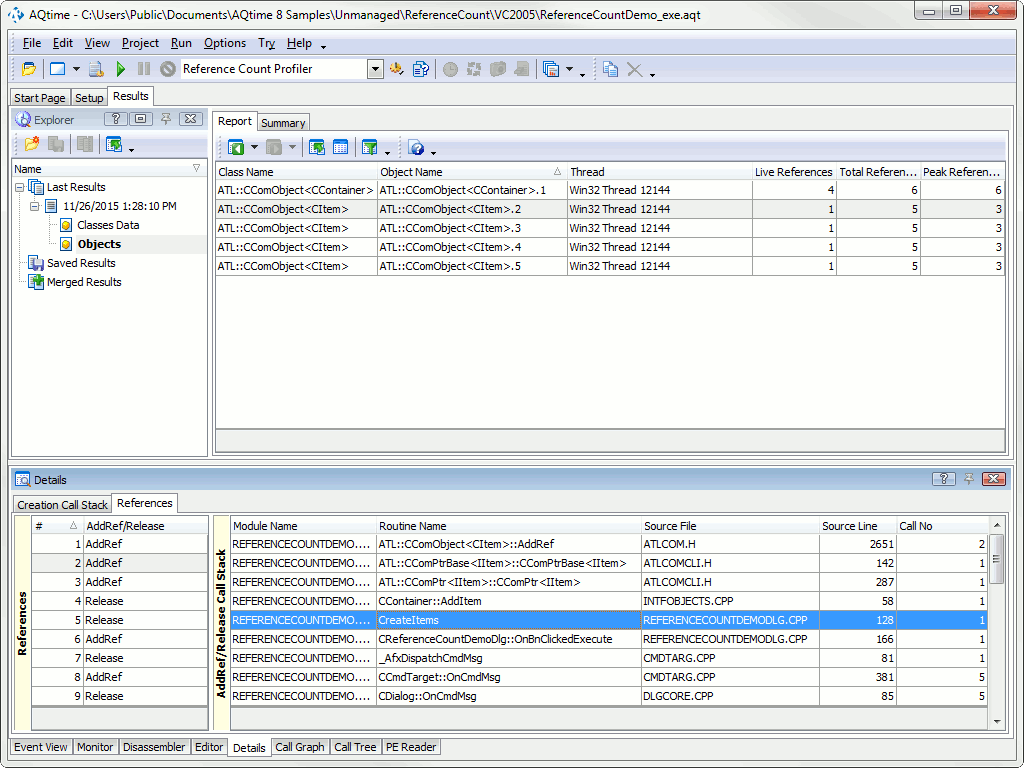
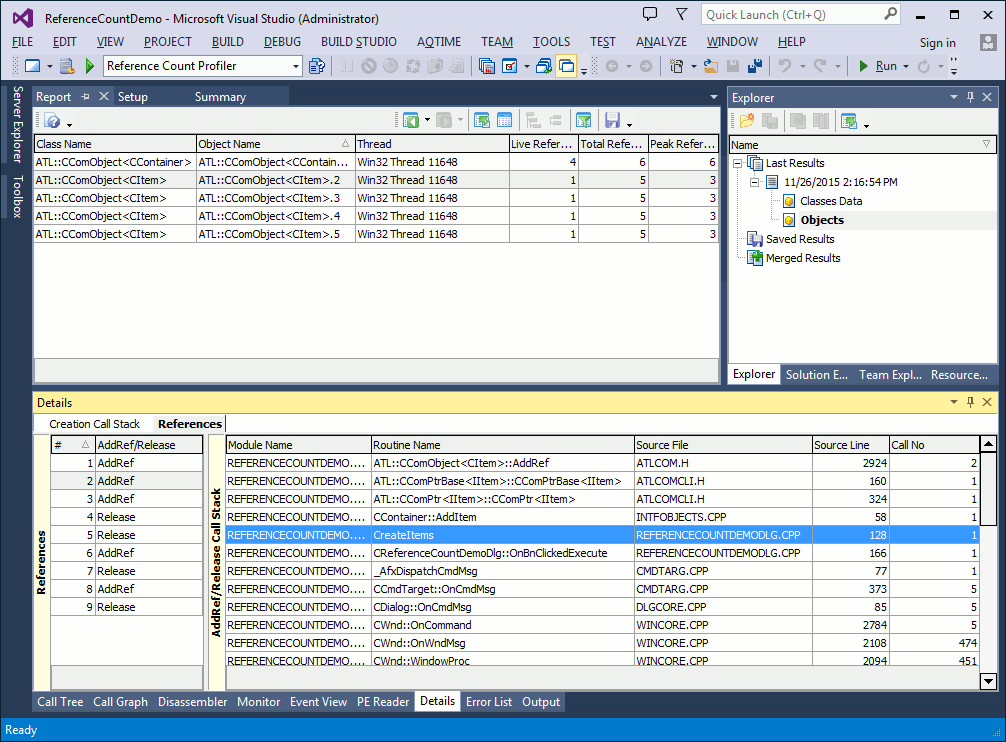
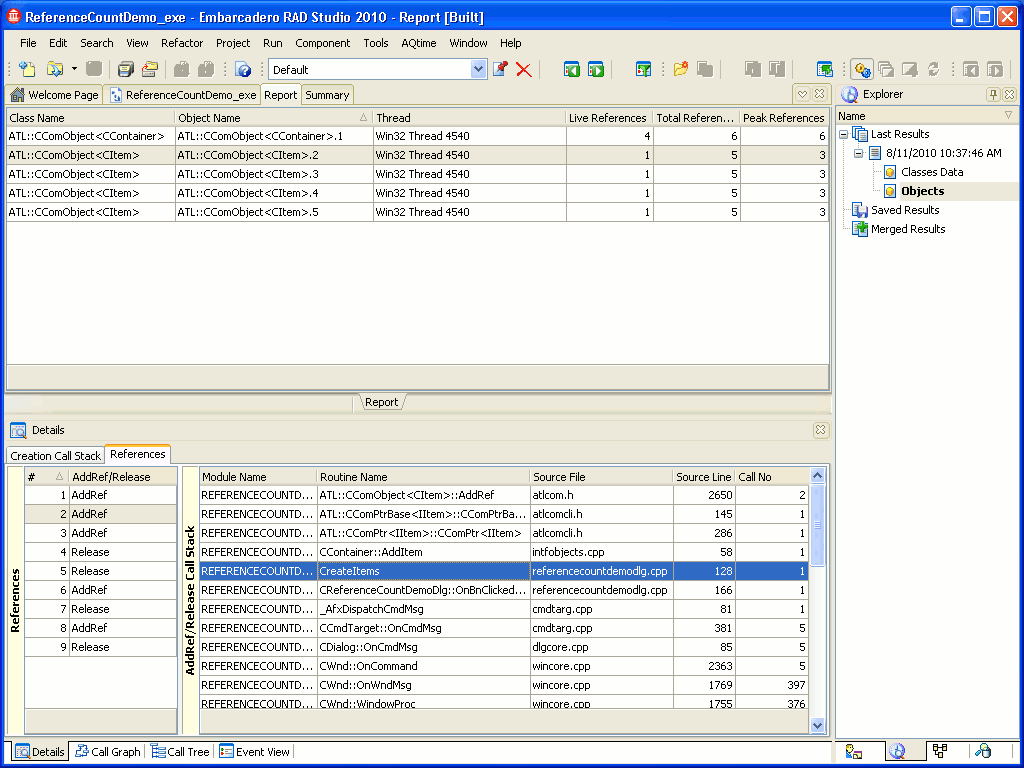
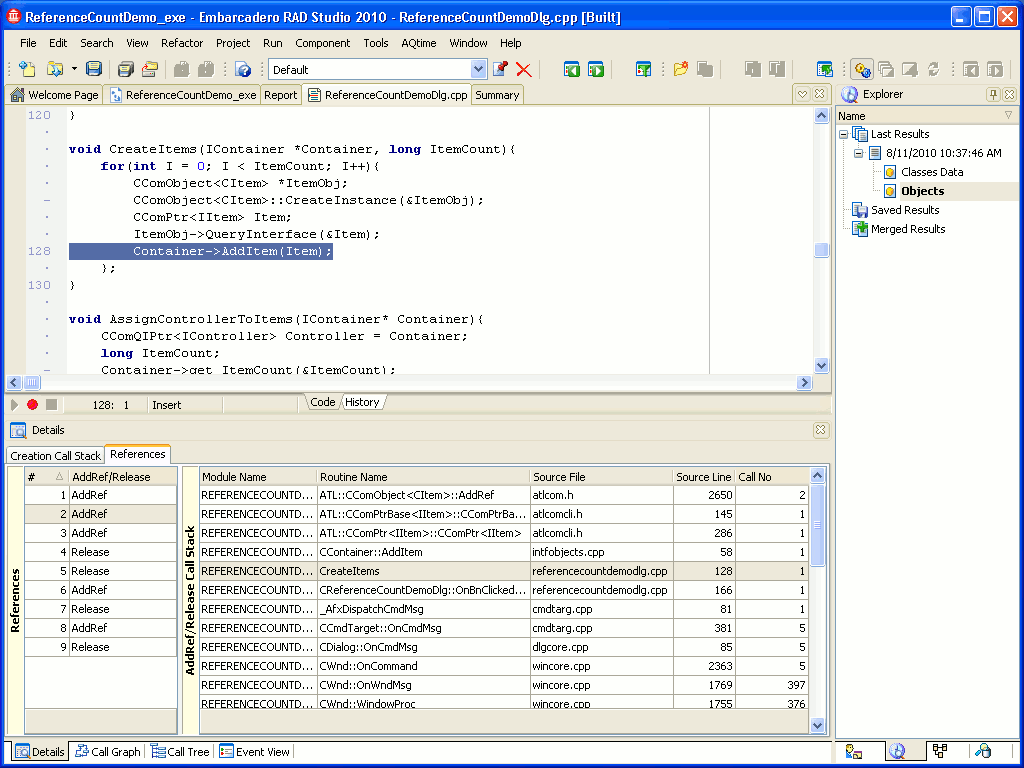
The Details panel contains two pages: Creation Call Stack and References. To explore the references, activate the References page. This page contains two tables: References and AddRef/Release Call Stack. The References table contains information about the calls to the object’s AddRef and Release methods. You can use this table to quickly find code statements that added or released references to and from the object.
Select any AddRef method in the References table. The AddRef/Release Call Stack table will display the sequence of functions calls that led to the call of the selected method:
The topmost method in the call stack is the method that called the selected AddRef (or Release) method. The method on the second row called the method on the first row and so on.
To view the source code of a method that is included in the call stack, double-click this method in the AddRef/Release Call Stack table and then switch to the Editor:
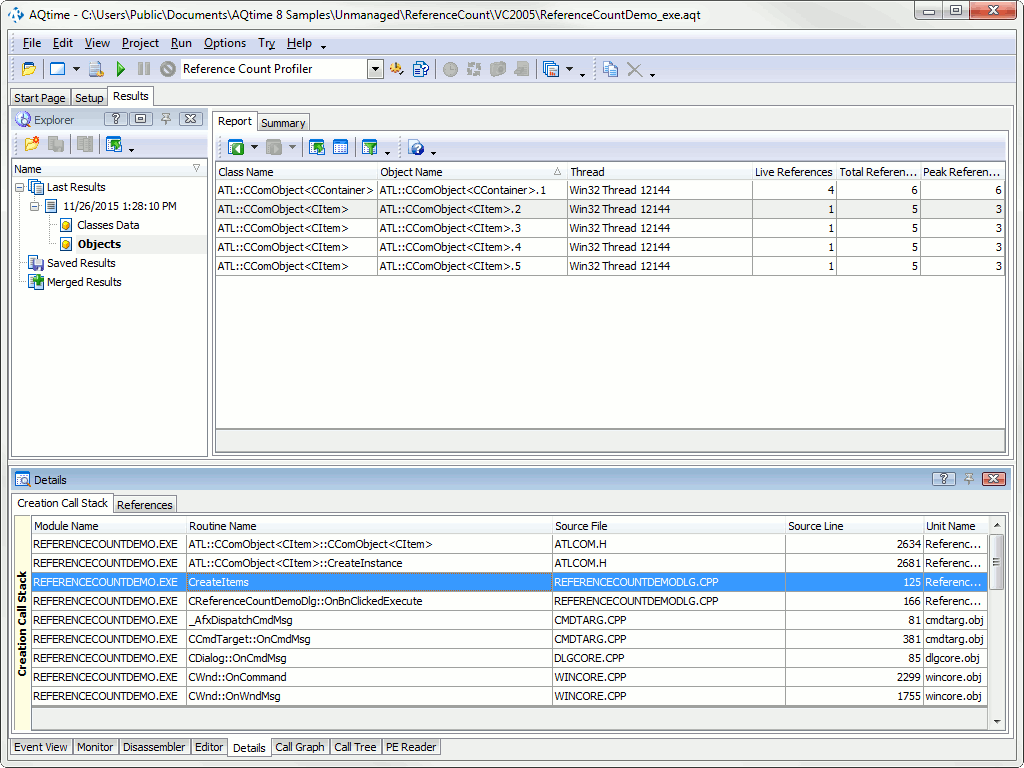
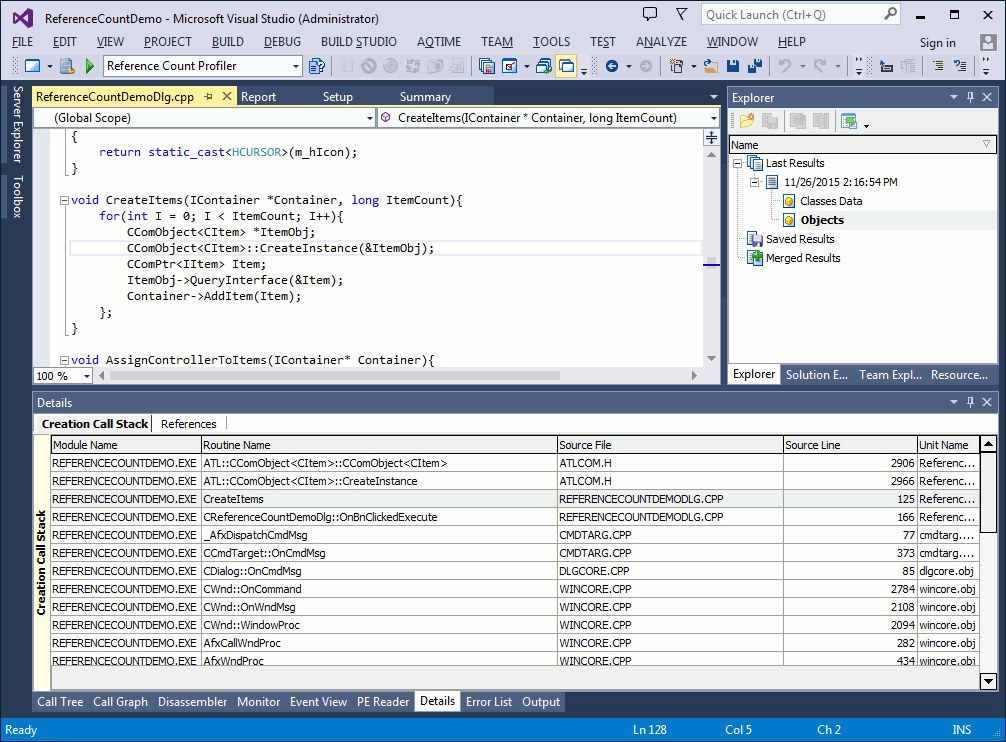
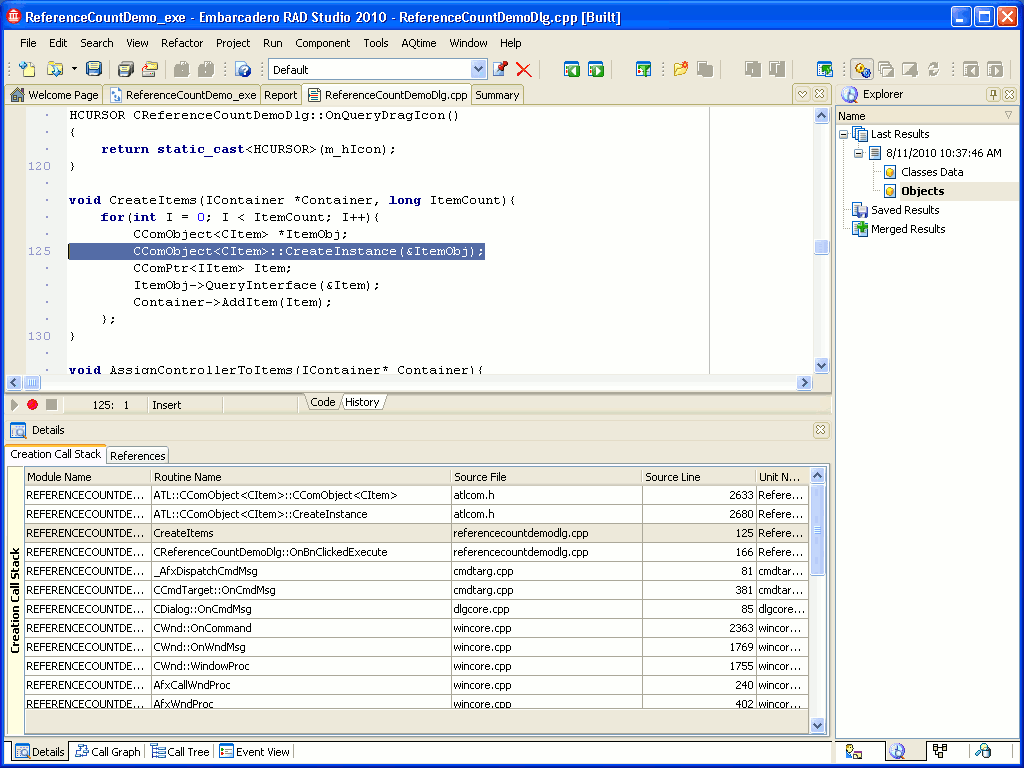
The other page of the Details panel, Creation Call Stack, displays the sequence of function calls that created the object:
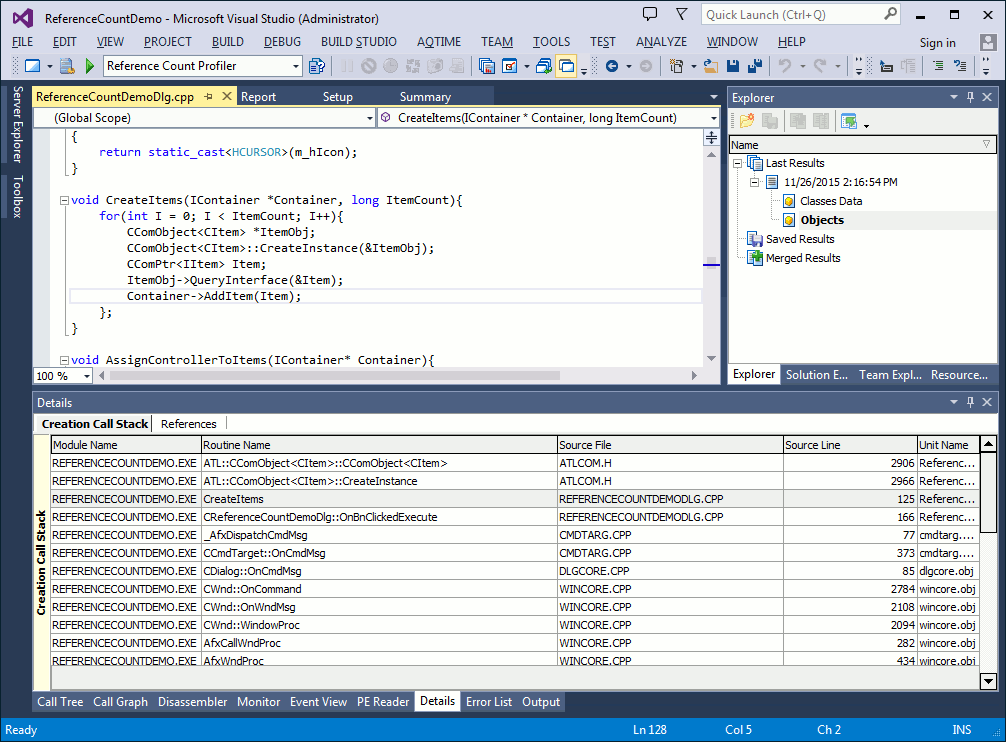
You can use this page to explore the creation of the desired object. To view the source code of a routine listed in the call stack, double-click the desired routine in the Creation Call Stack page and switch to the Editor:

 Prev
Prev