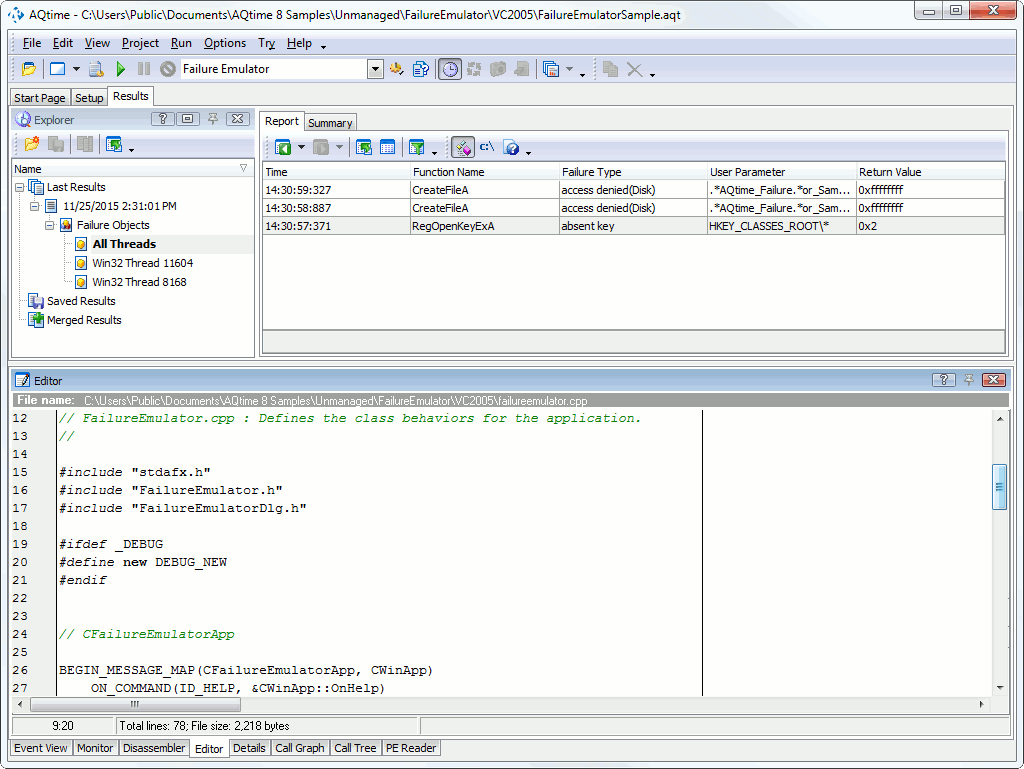
The Explorer panel displays result sets under the Failure Objects node:
The Report panel shows information on failures that were simulated while profiling the application. Take a look at the Failure Type column. It displays the type of the failure that was specified before starting the profiling in the Profiler Options dialog. The Report panel also contains the User Parameter column that shows the parameter that was specified for the corresponding failure emulation.
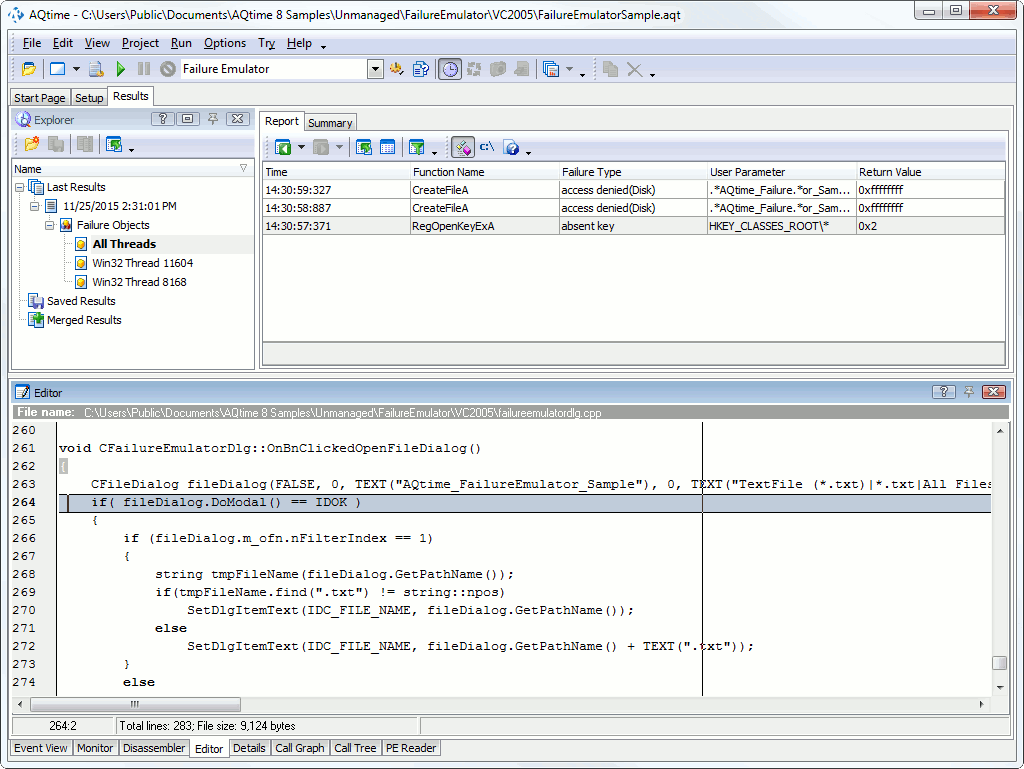
You can also view the source code of the application. For this purpose, just switch to the Editor panel (the appropriate tab is shown at the bottom of the AQTime window by default):
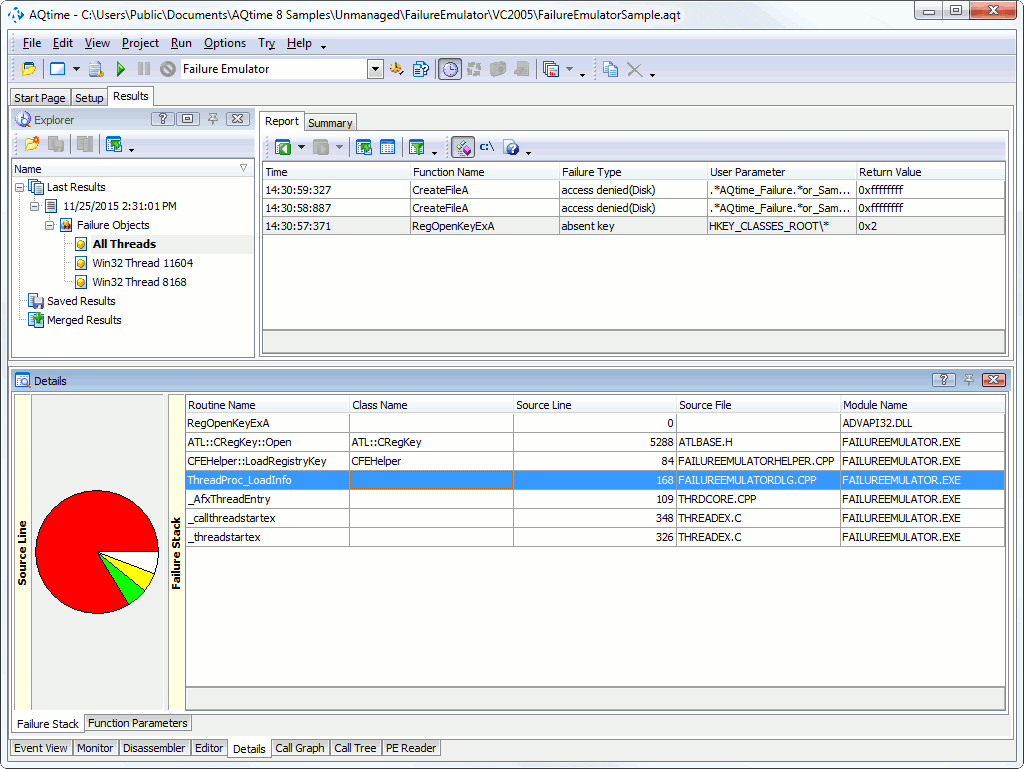
To view a call stack for the desired failure emulation, select the corresponding row in the Report panel and switch to the Details panel:
The Failure Stack pane of the Details panel displays a stack of function calls that led to the simulation of a failure that occurred in the function selected in Report. The top function is the very function that simulated the given failure. Double-clicking a function displays its source code (if it is available) and highlights the specified line in the Editor panel. (The link to source code is only available if your application was compiled with debug information. See How AQTime Profilers Use Metadata and Debug Information. In addition, the path to source files must be specified in the Project Search Directories or Search Directory dialog.)
| Note: | If the call stack is empty, most likely, you have not added any elements to the Collect Stack Information pane or you have not selected any stack area in this pane. For more information, see Specifying Modules to Be Included Into the Call Stack.
Another possible reason is the absence of debug information for profiled modules that have been added to the Collect Stack Information pane. For more information, see How AQTime Profilers Use Metadata and Debug Information. |
After you have obtained the exact line that caused the failure, you can modify the application source code, so it can prevent such failures in the future (if necessary).


 Prev
Prev