The Coverage profiler results are divided into three categories: Routines, Modules and Source Files. When the Modules category is selected, each row in the Report panel corresponds to a single module of your application.
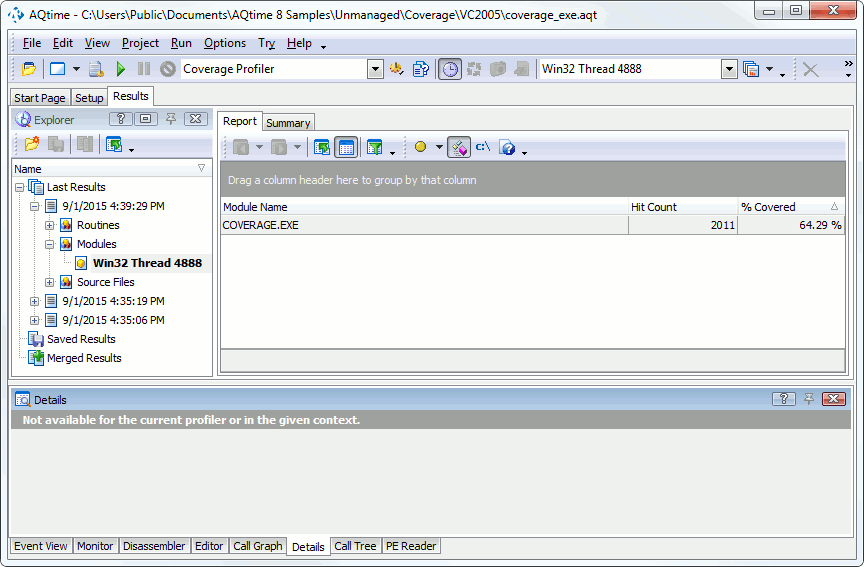
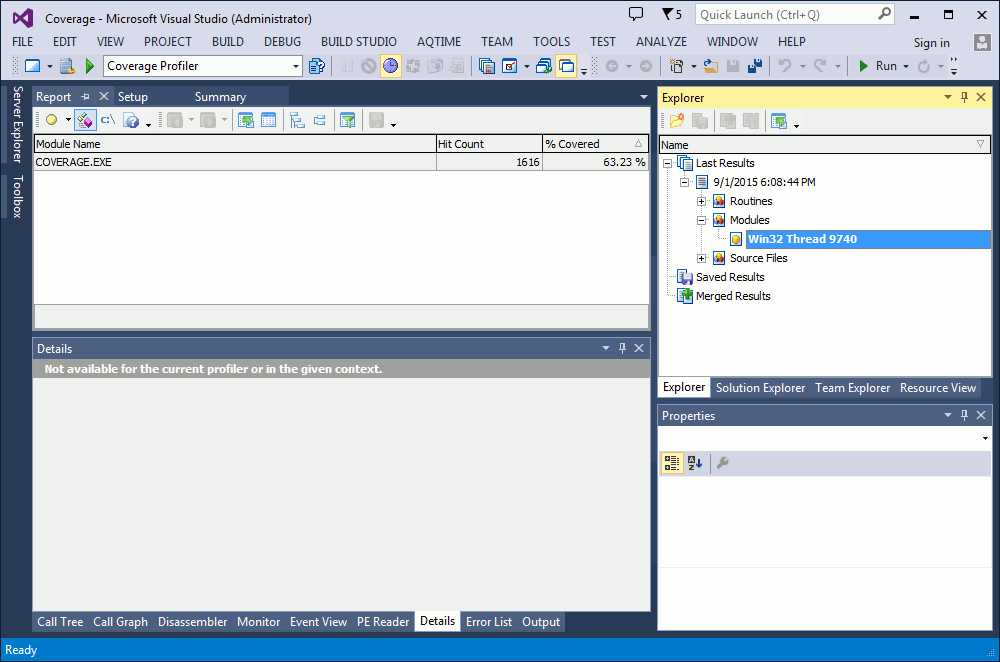
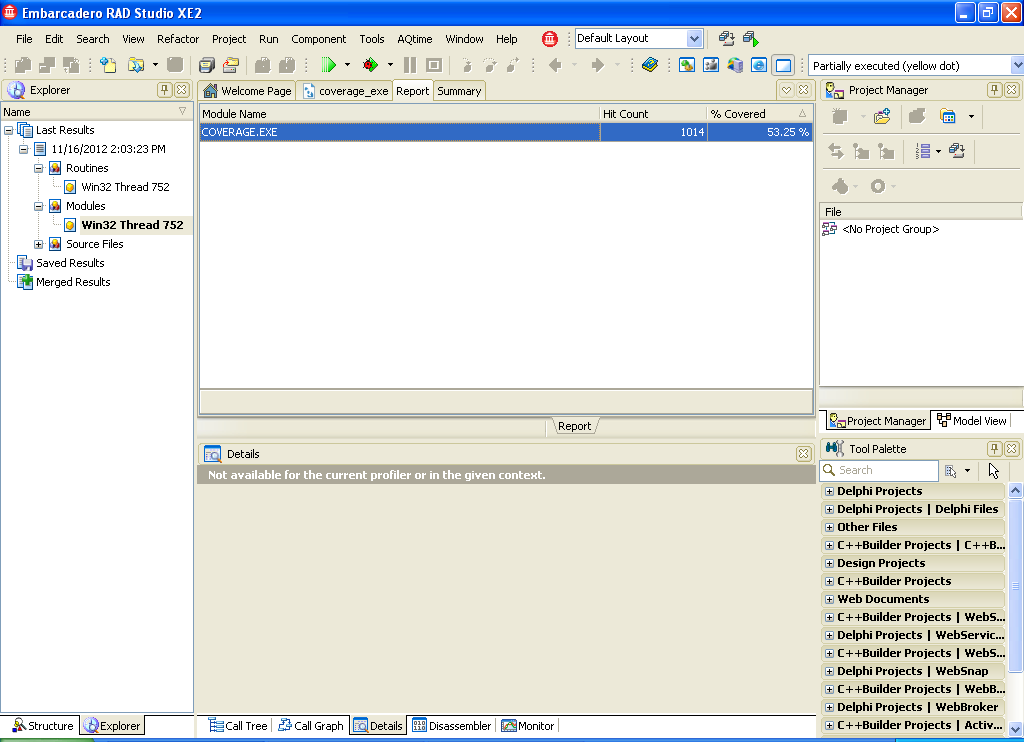
Below is a sample output of Coverage profiler results displayed in the Modules category:
Every row in the Report panel holds results for an individual application module:
-
Modules' names are specified in the Module Name column.
-
The Hit Count and Skip Count columns show the number of routine calls that were profiled and excluded from the profiling respectively.
-
The % Covered column shows the overall percentage of covered lines in the given module. Use the value of this column to estimate whether your automated tests completely cover individual application modules.
Note: Partially executed lines are counted according to the Mark partially executed lines as option value. For more information on this, refer to the Profiling Partially Executed Lines topic.
For a detailed description of all available columns refer to Coverage Profiler Panels Reference.
See Also
Coverage Profiler Results
Report Panel
Explorer Panel
Details Panel
Analyzing Profiler Results


