The Sequence Diagram Link profiler analyzes the sequence of function calls in your application and then builds a UML-style diagram of function calls in Microsoft Word or Microsoft Visio.
General Information
The Sequence Diagram Link profiler is a convenient tool to trace links between methods and functions without running the application. Note that these are potential links between routines, since the profiler statically analyzes your application and it cannot predict whether conditional calls will be performed.
The profiler has the following specifics:
-
The profiler supports routine-level areas only. Line-level areas and the Entire .NET Code settings are ignored.
-
If a routine was not included in profiling, the profiler does not parse it and does not parse calls to its child functions.
-
The profiler analyzes only routines that are located in the module, to which the start-point routine belongs. It will ignore all other routines, even if they are specified in the “Including” areas.
-
The profiler ignores calls to abstract and interface methods. The reason for this is that debug info does not contain information on these methods, so the profiler is unable to analyze them.
-
Calls to properties are displayed as calls to property’s read or write methods (
get_PropertyNameandset_PropertyName). If a property does not have a read (write) method, calls to this property are ignored.
Requirements
The profiler creates UML diagrams of function calls in Microsoft Word or Microsoft Visio. To run the profiler, you must have one of the supported versions of Microsoft Word or Microsoft Visio installed on your computer, otherwise, an error occurs.
Currently, the profiler supports the following versions of Microsoft Word and Microsoft Visio:
-
Microsoft Word 97 or higher.
-
Microsoft Visio 2000 or higher.
The program in which the diagram will be created is specified by the Target application option of the profiler.
How the Profiling Algorithm Works
The profiler algorithm is based on backtracking.
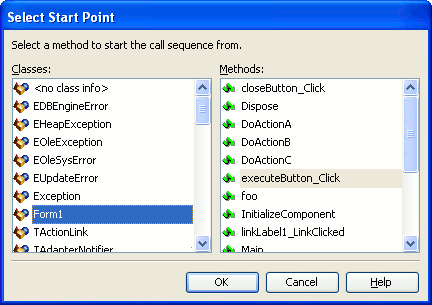
When you start the profiling, in the Select Start Point dialog, select the routine that will be the starting point of analysis:

The profiler parses the binary code of this routine and determines the functions called from it. Then it parses the first function found and, if it finds calls to child function, it continues to the first child function it finds.
The analysis is performed recursively until the profiler finds a function, which has no child function calls. When all functions at a given level have been analyzed, the profiler moves up one level and continues with the next function.
The profiler can work until it parses all functions in the module. However, to avoid creating of overly complex diagrams, AQTime lets you stop the analysis when the number of parsed routines exceeds the value specified by the Warning level profiler option.
Profiling Results
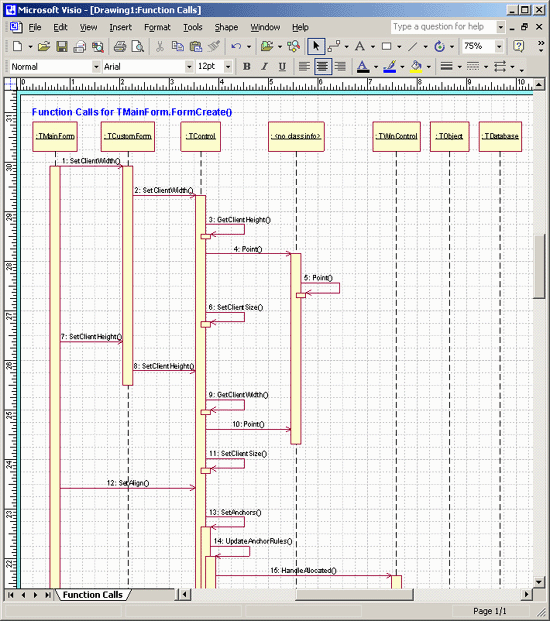
After the profiling is over, the resulting UML diagram is displayed in the specified application. For example, the following diagram was created in Microsoft Visio:
The diagram displays what methods of what classes call methods of other classes.
See Also
Sequence Diagram Link Profiler
Sequence Diagram Link Profiler Options

 General Information